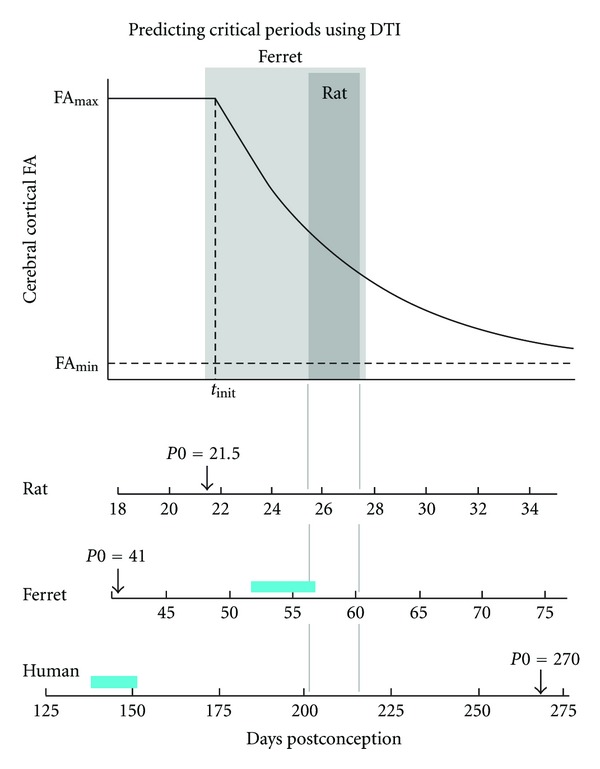
Figure 4.

Water diffusion anisotropy (FA) within the developing cerebral cortex versus postconceptional age. The upper trace is a plot of the dependence of cerebral cortical FA on age, as given by (1) (see text). Below, abscissas for the plot are given in terms of postconceptional ages in days, using t init and τ values obtained by analyzing rat data reported by Huang et al. [10], ferret data from Kroenke et al. [11], and human data from McKinstry et al. [12], following procedures described in [13] (see text for details). The dark gray shaded area represents the lower and upper age bounds of the critical period for callosal connectivity using data available for the rat [5, 6] (the rat critical period, P4–P6, corresponds to 25.5–27.5 days post conception). The light gray shaded area represents the ages explored in the ferret [8] (P7 and P20, which correspond to 48 and 61 days post conception, resp.). The duration in days of gestation up to birth (P0) is indicated for each species (arrows). Gray lines indicate time range corresponding to the critical period in rats (P4–P6), which predicts critical periods for ferret (P15–P19; PC56–PC60) and human (PC201–PC217) according to the cortical FA trajectory. Blue bars indicate time ranges translated from the rat critical period (P4–P6) to ferret (P11–15.5; PC52–PC56.5) and human (PC138–PC150), according to the Translating Time model developed by Finlay, and coworkers [14–17].
