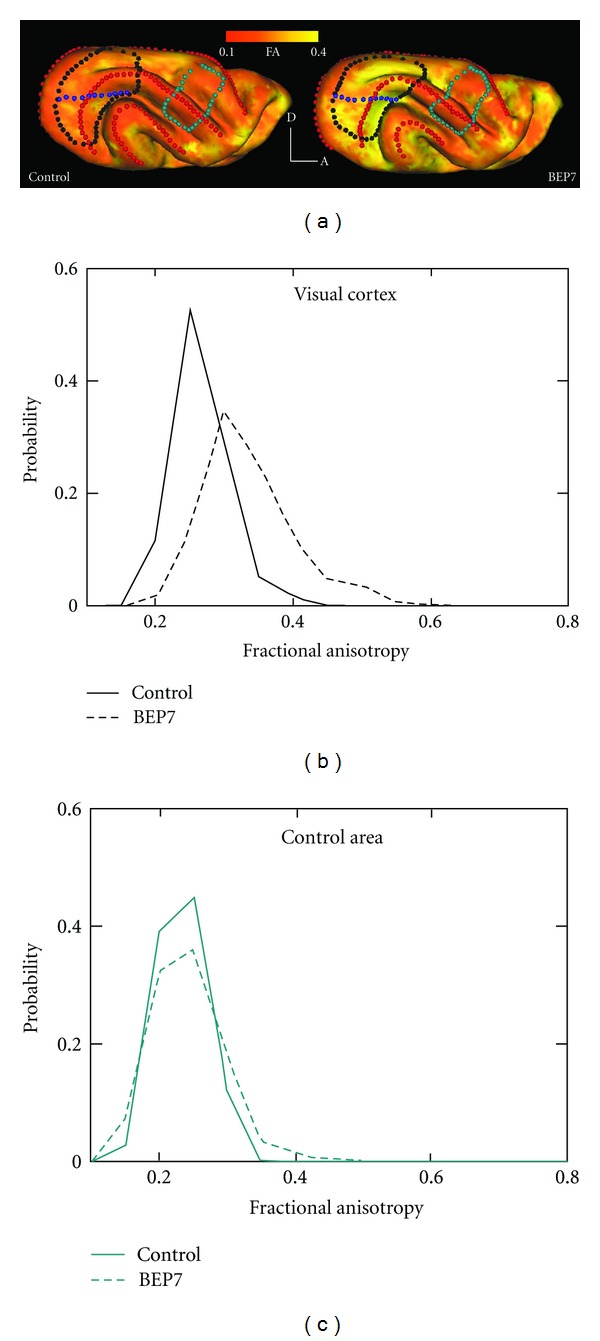
Figure 5.

Visual cortical FA is increased in BEP7 ferrets, relative to controls, at P31. (a) Cortical FA is projected onto lateral cortical surface models for one control and one BEP7 ferret, according to the red/yellow color scale (posterior is left, dorsal is up). The BEP7 surface exhibits greater FA (brighter yellow) than the control in visual areas (encircled by black dots) at P31, while no differences in FA are apparent in a control, nonvisual area located more rostrally (encircled by blue-green dots). Blue dots indicate the approximate location of the horizontal meridian representation. Red dots indicate crowns of gyri. (b, c) Histograms represent data from either two BEP7 or two control ferrets. Comparison of these histograms illustrates that differences in cortical FA are observed in visual areas (b), but not in the nonvisual control area (c). Adapted from Bock et al. [18].
