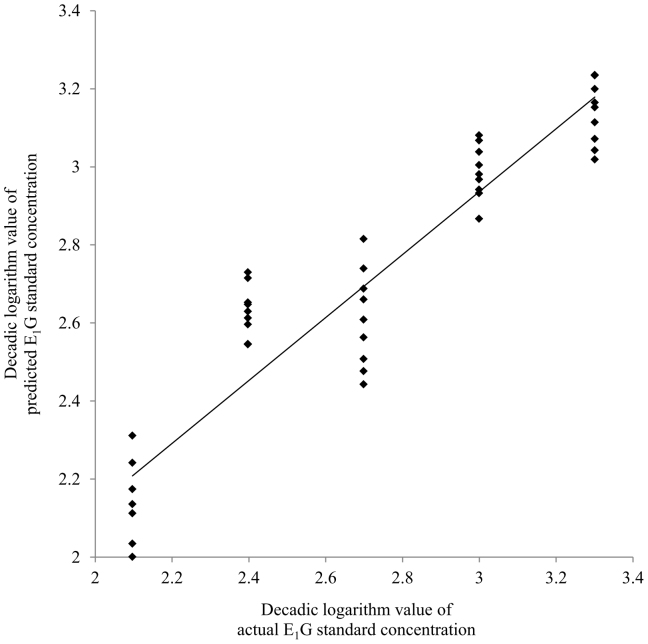
Figure 4. Relationship between actual and predicted estrone-3-glucuronide (E1G) concentrations by partial least square regression (PLSR) of the absorbance values of E1G standard spectra at the water matrix coordinates (WAMACs).
Actual E1G concentrations (125–2000 pg/ml) were transformed into decadic logarithm values (2.1–3.3) and these values were used for PLSR as reference values. Each point shows an E1G standard spectrum.

