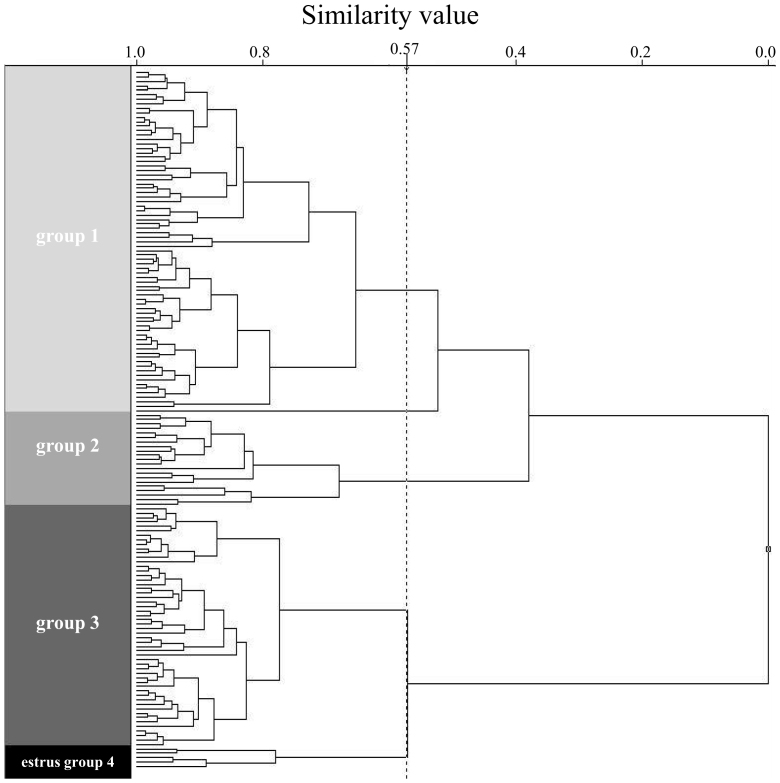
Figure 5. Dendrogram of hierarchical cluster analysis (HCA) of urinary spectra from a female giant panda.
The absorbance values at water matrix coordinates (WAMACs) were normalized by auto-scaling and used for this analysis. The two values in the dendrogram represent the levels of similarity between groups 1 and 2, and between groups 3 and estrus group 4.

