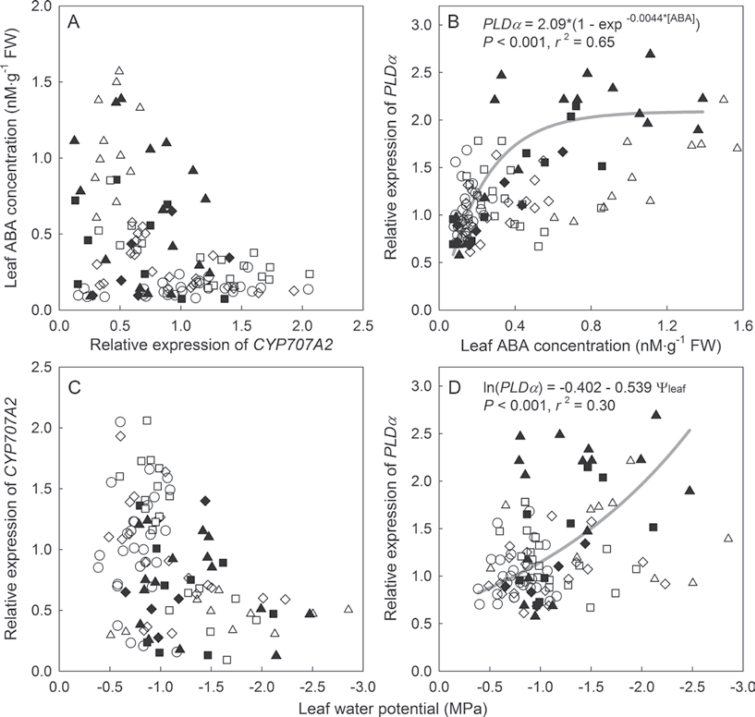
Fig. 5.
Relationships between relative expression of CYP707A2 and PLDα in Petunia leaves and leaf abscisic acid (ABA) concentration (A and B) and midday leaf water potential (Ψleaf; C and D). Substrate water content treatments: 0.40 (circles), 0.30 (diamonds); 0.20 (squares), and 0.10 m3·m–3 (triangles). Closed symbols indicate data collected during the drying period and open symbols indicate data collected after substrate water content thresholds had been reached. Regression curves indicate significant relationships between gene expression and leaf ABA concentration/midday leaf water potential during the drying period.

