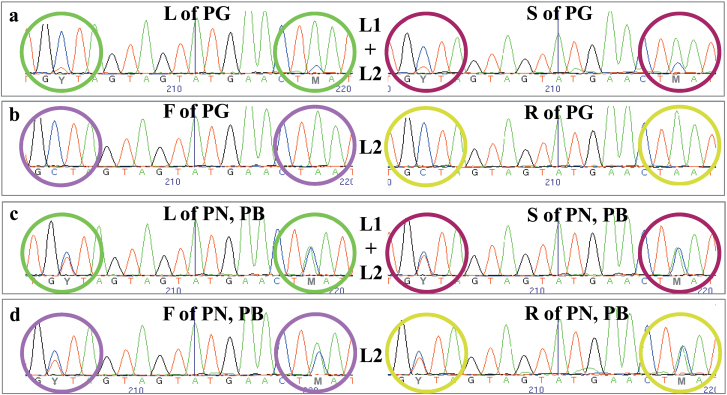
Fig. 2.
Comparison of the electropherograms obtained by resequencing the SNP6166 region among the studied Pinot colour somatic variants. Differently coloured circles highlight the point mutations Y (C/T) and M (A/C) in leaf (L), berry skin (S), berry flesh (F), and root (R) of Pinot noir (PN), Pinot gris (PG), and Pinot blanc (PB). Allelotyping and peak height are depicted. In particular, (a) shows the heterozygous state with an under-represented allele in L1+L2-derived tissues of PG, while (b) reveals the homozygous-like state in pure L2-derived tissues of PG. (c) and (d) show the fully heterozygous state in both L1+L2-derived and pure L2-derived tissues of PN and PB.

