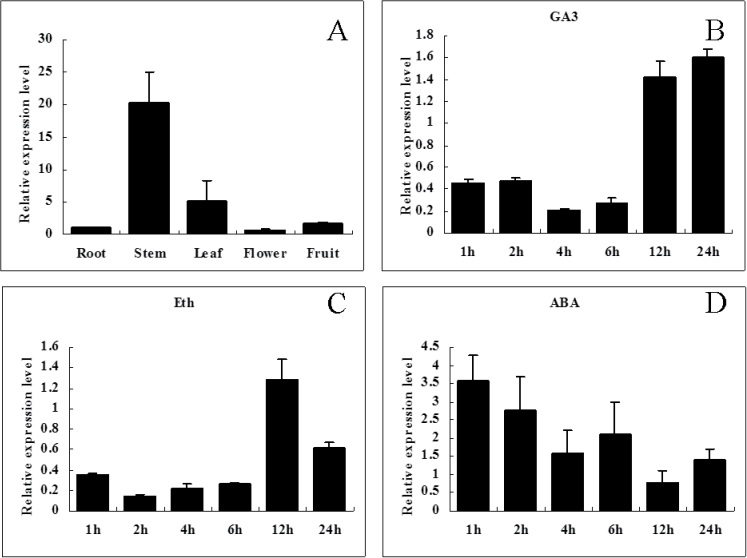
Fig. 4.
Real-time RT-PCR analysis of the expression of SlDREB in WT tissues (A) and in response to the phytohormones GA3 (B), ABA (C), and Eth (D). All samples were collected at the indicated time points. Expression of phytohormone-treated WT plants was compared with that in untreated plants after normalization of values with reference to the tomato β-actin gene and is presented as the relative expression level. All samples were collected at the indicated time points from three biological replicates in each treatment group. Error bars indicate the standard error (SE) of three replicates.

