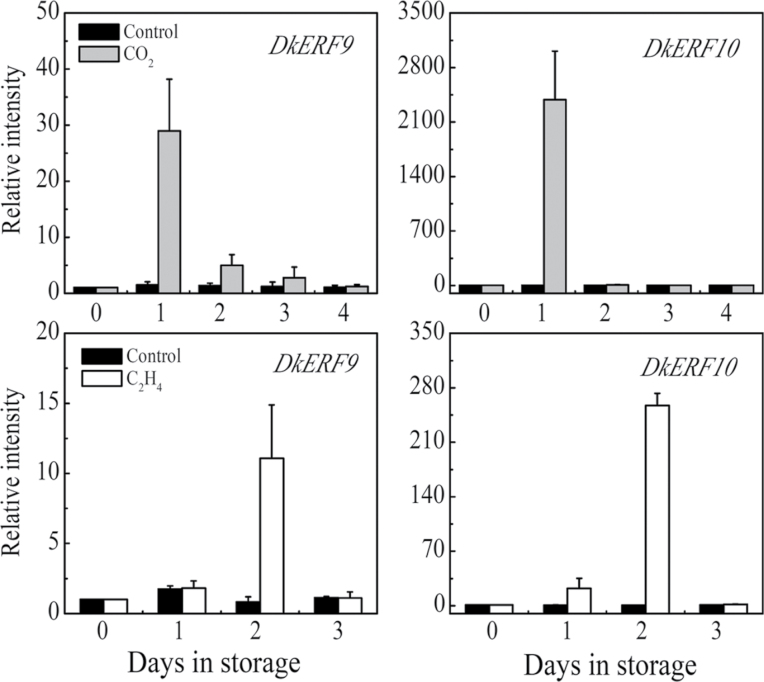
Fig. 2.
Transcriptional analysis of hypoxia responsive DkERF9 and DkERF10. Transcripts of DkERF9 and DkERF10 were measured by real-time PCR in response to CO2 and ethylene treatment. Mature fruit were treated with ethylene (100 µl l–1, open circles, 2 d) and air (control, open squares), separately. A horizontal arrow represents the end day of the treatment, when the fruit were transferred to air at 20 °C. Day 0 fruit values were set as 1. Error bars indicate SEs from three biological replicates.

