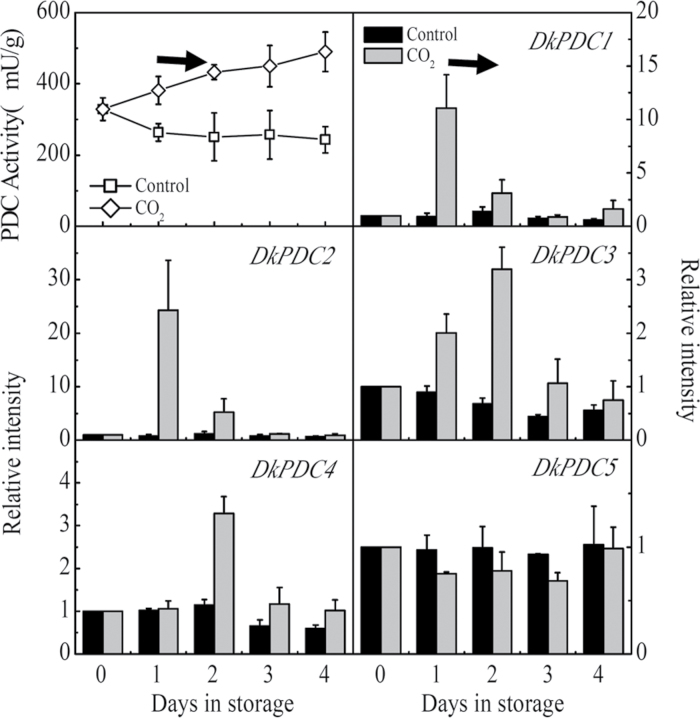
Fig. 6.
Changes in PDC enzyme activity and mRNA amounts from specific genes in response to CO2 treatment. Mature fruit were treated with CO2 (~95%, v/v, open diamonds, 1 d) and air (control, open squares), separately. A horizontal arrow represents the end day of the treatment, when the fruit were transferred to air at 20 °C. Day 0 fruit values were set as 1. Black columns and white columns represent relative mRNA abundance of the gene transcripts in control and ethylene-treated fruit, respectively. Error bars indicate SEs from three biological replicates.

