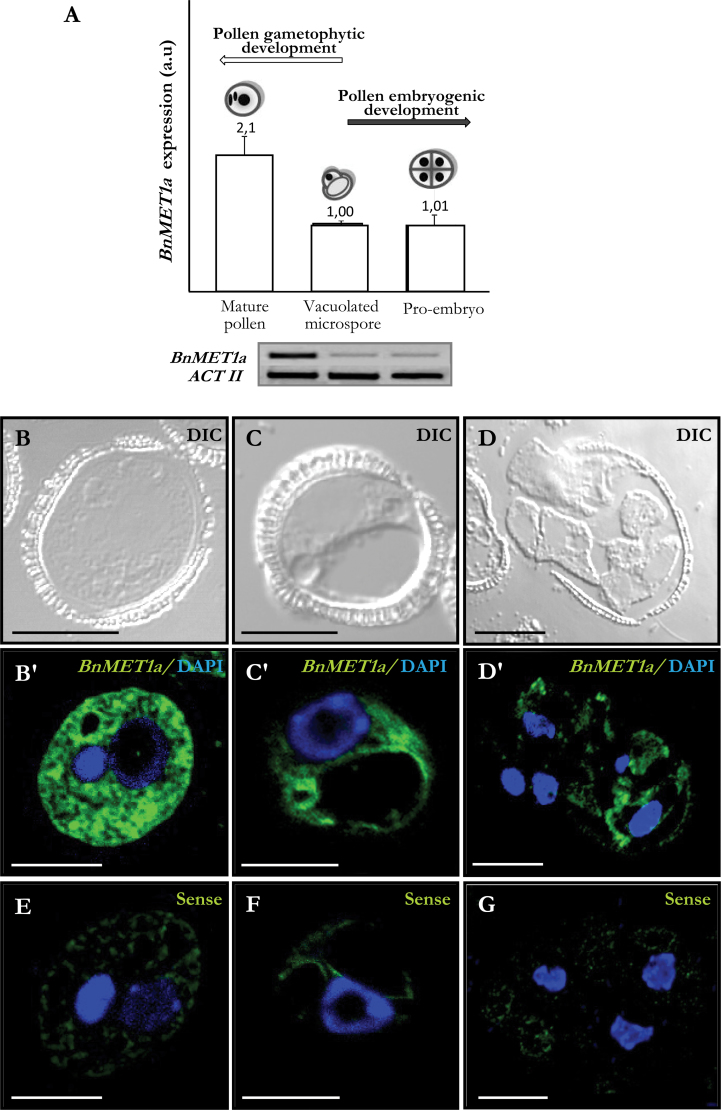
Fig. 4.
BnMET1a-like expression during pollen development and after pollen reprogramming. (A) Reverse-transcription PCR relative band intensities in arbitrary units (a.u.) and representative electrophoresis gels of the amplification products. (B–G) FISH localization of BnMET1a transcripts. Differential interference contrast (DIC) images and merged images of FISH signals (green) and DAPI staining of nuclei (blue). B, C, and D are differential interference contrast images of the same structures as B’, C’, and D’, respectively. (B, B’) Mature pollen. (C, C’) Vacuolated microspore. (D, D’) Multicellular pro-embryo with exine. (E–G) FISH controls with the sense probe in mature pollen (E), vacuolated microspore (F), and multicellular pro-embryo (G). Bars, 10 µm (B, B’, C, C’, E, F), 20 µm (D, D’, G).

