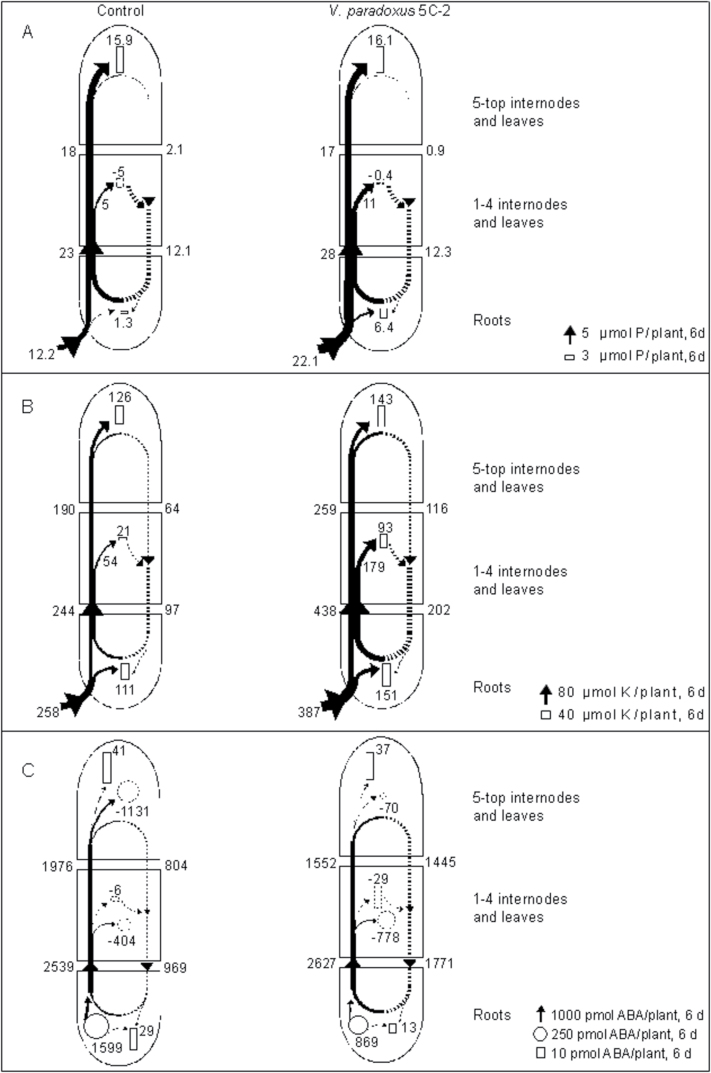
Fig. 2.
Empirical models of the uptake, transport, and utilization of total phosphorus (A) and potassium (B), or the metabolism, transport, and deposition of ABA (C) in whole pea plants over a 6 d study period. Arrow widths [net flows in xylem sap (black) or phloem (dotted)] and rectangle heights (deposition in each organ) are drawn in proportion to flow rates and the magnitude of deposition, respectively. Circled areas in (C) are drawn in proportion to the rates of metabolism.

