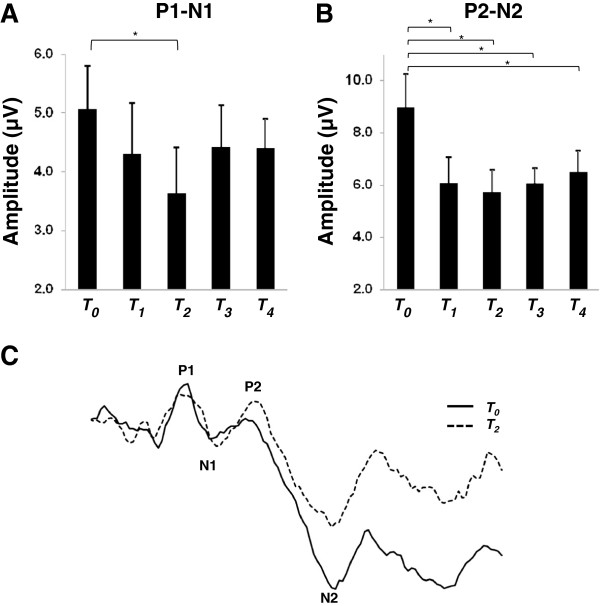
Figure 2.
SEPs before and after cTBS. A. Group-averaged P1-N1 (with standard error) recorded before and at each time block following cTBS. B. Group-averaged P2-N2 (with standard error) recorded before and at each time block following cTBS. C. SEP trace from an individual participant depicting location of the P1, N1, P2 and N2 components at T0 (before) and at time block T2 (12 to 16 minutes) following cTBS. Asterisks indicate p < 0.05.

