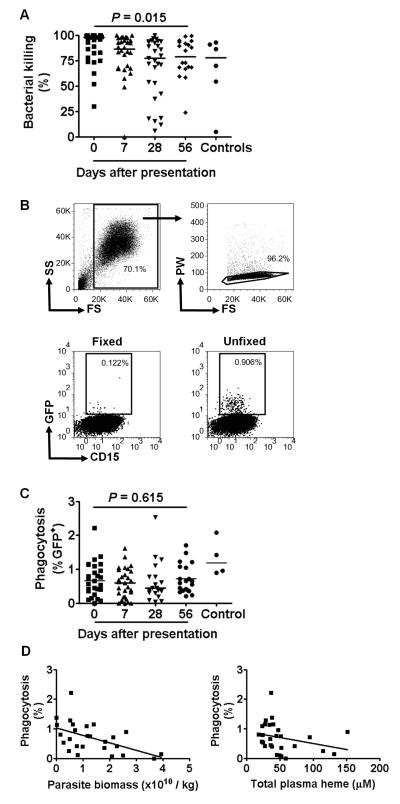
FIGURE 5.
Ex-vivo killing and phagocytosis of S. typhimurium by neutrophils from children with P. falciparum malaria. (A) Killing of S. typhimurium. Neutrophils isolated on days 0, 7, 28 and 56 after presentation with P. falciparum malaria were mixed with S. typhimurium at ratio of 50:1 and killing expressed as the percentage reduction in bacterial numbers after 2 h incubation. Statistical comparison using Friedman’s two way ANOVA for all subjects with valid data at all time points, n=18. Data from control subjects shown for comparison. (B) Representative flow cytometry plots showing phagocytosis of GFP+ S. typhimurium by neutrophils isolated on day 0. RBCs and debris were excluded based on forward scatter and side scatter characteristics, then single cells were selected based on pulse width and forward scatter characteristics (upper row). The proportion of GFP+CD15+ cells was determined in samples where both neutrophils and S. typhimurium were fixed in 4% formaldehyde prior to incubation (to control for surface binding without phagocytosis), and in unfixed samples (lower row). (C) Phagocytosis of S. typhimurium. Neutrophils isolated on days 0, 7, 28 and 56 after presentation with P. falciparum malaria were mixed with S. typhimurium at a ratio of 50:1 and phagocytosis expressed as the percentage GFP+ neutrophils after 15 min incubation. The percentage GFP+ cells was calculated by subtracting the proportion of GFP+ cells in formaldehyde fixed samples from that in unfixed samples. Statistical comparison using Friedman’s two way ANOVA for all subjects with valid data at all time points, n=7. Data from control subjects shown for comparison. (D) Correlation of phagocytosis (on day 0) with parasite biomass on day 0 (left hand panel, n=26) and total plasma heme on day 0 (right hand panel, n=28).

