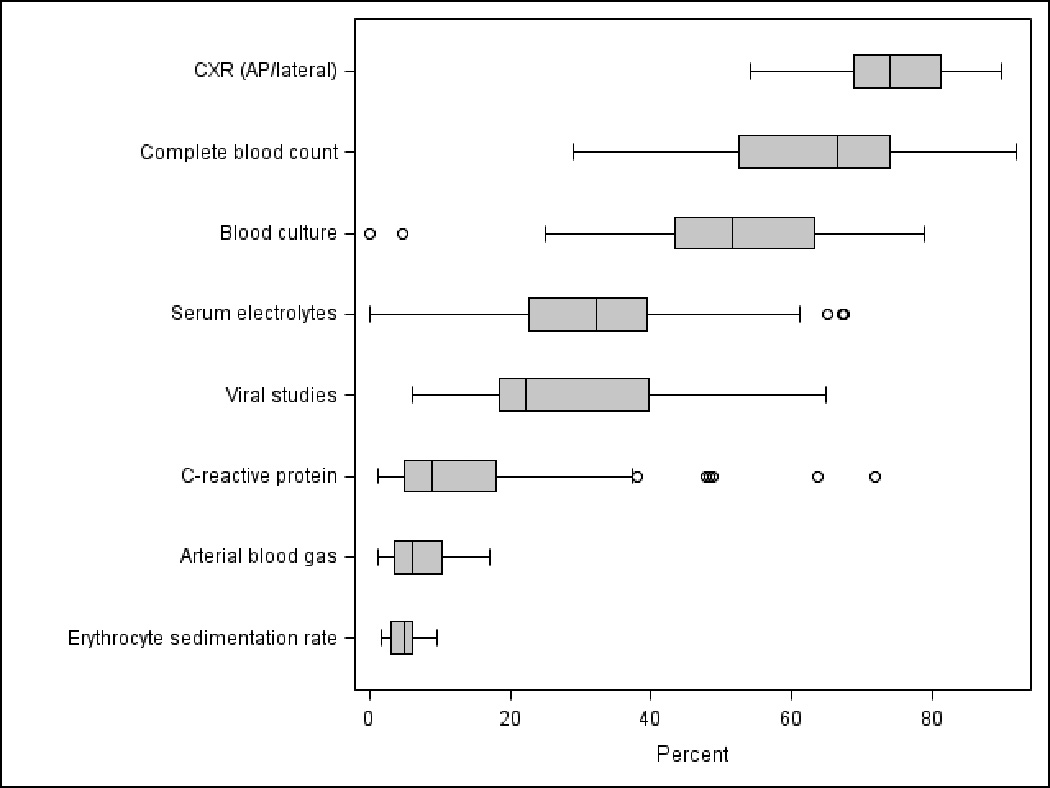
Figure 1.

Hospital-level variation in selected processes of care among children hospitalized with community-acquired pneumonia. The line intersecting each box represents the median of the median proportion of patients at each hospital receiving selected processes of care. The ends of the box represent the 25th and 75th percentile hospital values, while the “whiskers” represent values that are 1.5 times the interquartile range. Circles represent extreme outliers.
