
Figure 8.
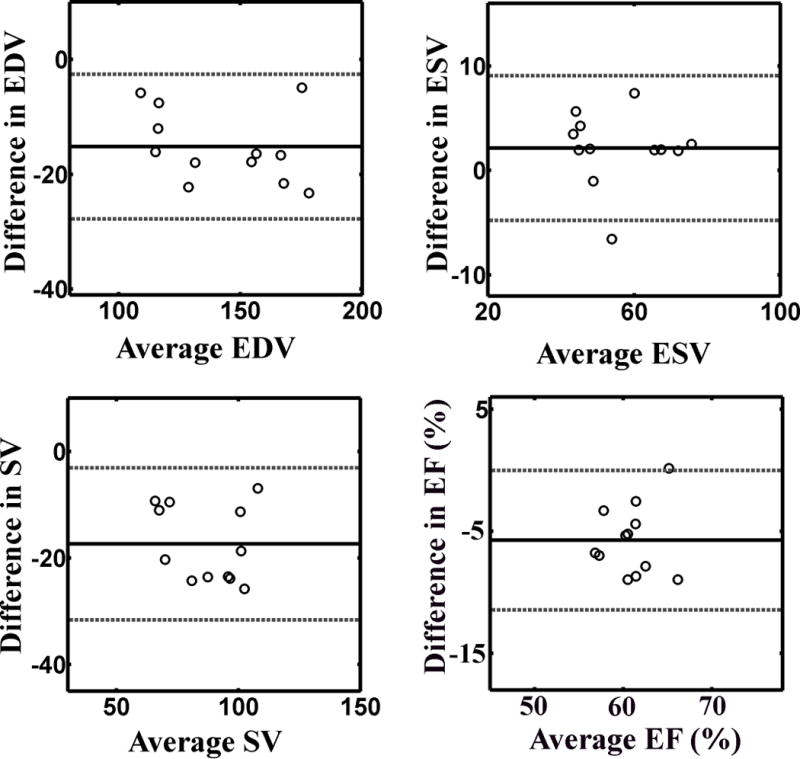
Bland-Altman plots illustrating good agreement between breath-hold cine MRI and real-time cine MRI for the following LV function measurements: (top, left) EDV (mean difference −15.2 ml [solid line]; lower and upper 95% limits of agreement −27.6 and −2.8 ml [dashed lines], respectively), (top, right) ESV (mean difference 2.1 ml [solid line]; lower and upper 95% limits of agreement −4.7 and 8.9 ml [dashed lines], respectively), (bottom, left) SV (mean difference −17.3 ml [solid line]; lower and upper 95% limits of agreement −31.3 and −3.3 ml [dashed lines], respectively), and (bottom, right) EF (mean difference −5.7 % [solid line]; lower and upper 95% limits of agreement −11.3 % and −0.1 % [dashed lines], respectively).