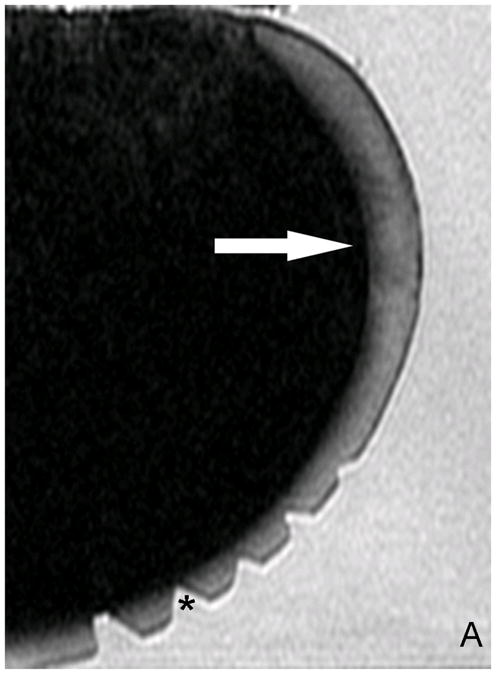
Fig. 2.

A) Original T2 -w image. Without color mapping the ROI (white arrow) in the human posterior femoral condyle (PFC) presents only subtle structural signal inhomogeneity. *(Cutting artifacts). B) SPGR image with fitted T1ρ color map. ROI in the PFC (sagittal image orientation through the knee) displays T1ρ values up to 120ms (red=abnormal, blue=normal cartilage) as an indicator for extended relaxation times due to an increase in cartilage bound water and a reduction in PG related to catabolic cartilage processes. C) Magnification of the ROI after repeated scanning of the separated PFC. D) Safranin-O stained histo section of a representative sagittal slice through the ROI shows focal PG (red) reduction and a bow-like intrasubstance fissure. The cartilage surface shows only mild irregularities. *(Cutting artifacts)

