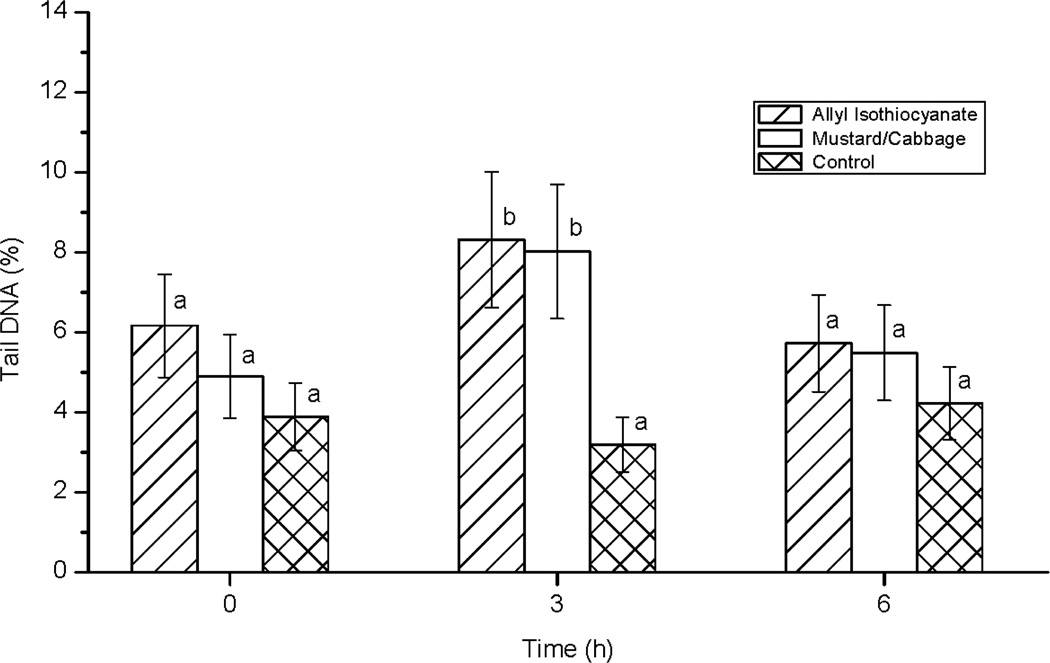
Figure 2.
Percent DNA in comet tail from peripheral mononuclear blood cells collected immediately before treatment consumption (hour 0) and at three and six hours after consumption. Analysis of variance was performed on logit-transformed data by the MIXED procedure in SAS. The results reported here are inverse transformed. Data are expressed as least square means. Error bars represent standard errors of the means. Means with different letters within an hour differ at P ≤ 0.05. Because LS means are a linear combination of effect in a model, and the models for the 10-day treatment intake and the acute treatment challenge were different (e.g., there was no hour effect to be estimated during the 10-day treatment intake), LS means computed for day 11 hour 0 were similar but not identical for the 10-day intake and acute treatment challenge models.

