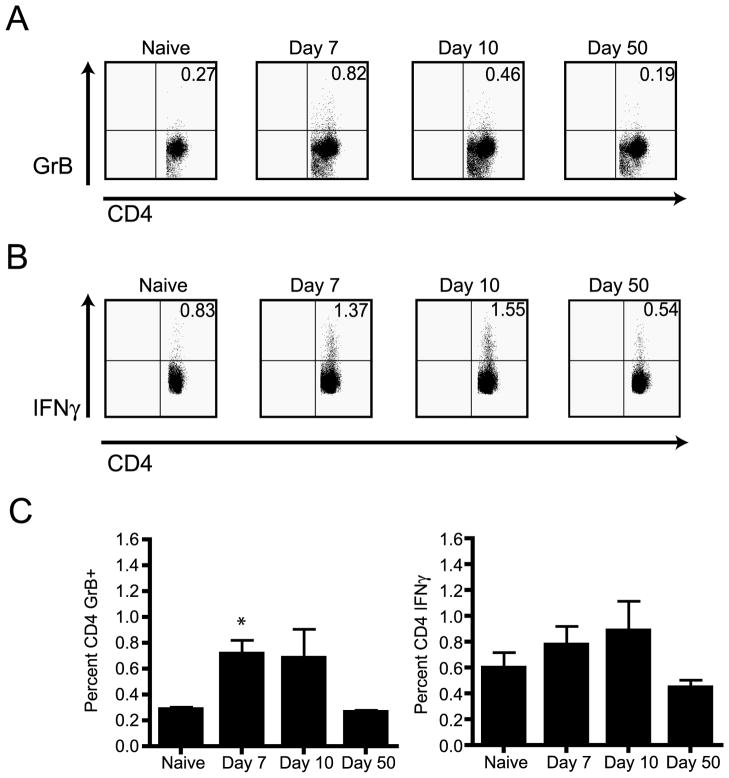
Figure 2. CD4 T cell response during West Nile virus infection.
A. Representative example of GzB expression by CD4 T cells after WNV infection as measured by direct ex-vivo intracellular FCM, without in-vitro stimulation. A naïve animal is shown as a control. Results are from one representative mouse of four mice from each time point. One experiment of two is shown. B. Representative example of IFNγ expression in CD4 T cells after WNV infection, measured by ICCS upon stimulation with 0.5μg/ml anti-CD3e (clone 2c11); a naïve animal is shown as a control. Results are from one mouse out of 4. Data is representative one experiment out of two. C. Left panel- Aggregate analysis of GzB expression in CD4 T cells, determined as in panel A. Percentage of CD4 GzB+ T cells for the time points given above. There is a significant induction of GzB in CD4 T cells on day 7 (p<0.02), but not on day 10 (p>0.05). Panels show average of four mice per time point (x± S.E.M.), representative of two experiments. Right panel- Aggregate analysis of IFNγ expression in CD4 T cells, determined as in panel B. Percentage of CD4 IFNγ+ T cells for the time points given above. Average of four mice per time point (x± S.E.M.), representative of two experiments.

