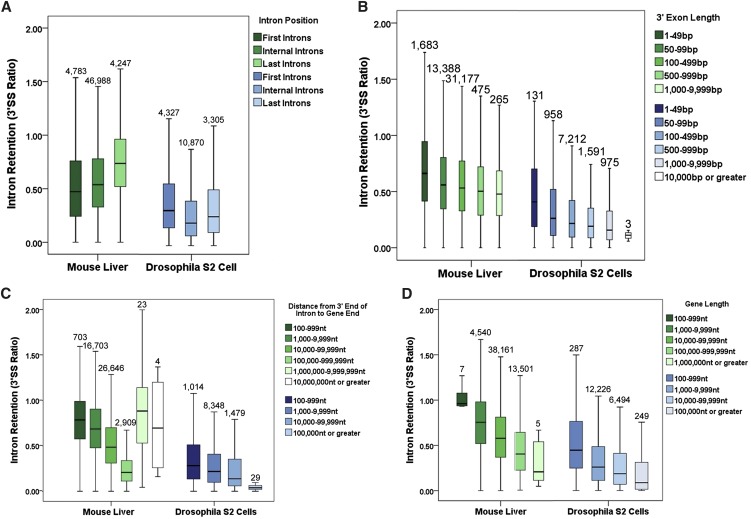
FIGURE 4.
Cotranscriptional splicing efficiency differs dramatically with intron position and the size of the gene. (A) Intron retention, as measured by the 3′SS ratio, differs significantly between first, internal, and final introns in both mouse (green) and fly (blue) (P < 0.001, Krustal-Wallis Test, all pairwise). (B) For internal introns in both mouse (green) and fly (blue), the length of the 3′ exon is negatively correlated with the 3′SS ratio (P < 0.001, Krustal-Wallis Test, all pairwise). (C) For internal introns in both mouse (green) and fly (blue), the distance of the intron from the end of the gene is negatively correlated with the 3′SS ratio. The exception is about 30 introns in mouse greater than a megabase away from the end of the gene (P < 0.001, Krustal-Wallis Test, all pairwise). (D) For all introns in both mouse (green) and fly (blue), the size of a gene containing a given intron is negatively correlated with the 3′SS ratio (P < 0.001, Krustal-Wallis Test, all pairwise). Box plots span the 95th–fifth percentiles.

