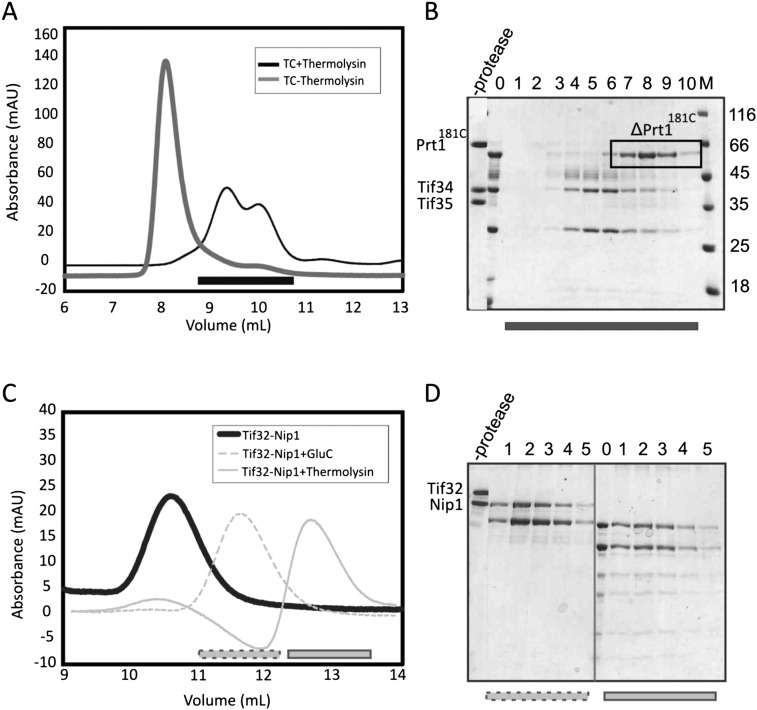
FIGURE 4.
Limited proteolysis of the subcomplexes of recombinant eIF3. (A) Analytical SEC profile of the Prt1181C/Tif34/Tif35 complex digested with thermolysin after 24 h. Resulted fragments do not form the complex as manifested by the presence of two peaks shifted to the right (dark gray) compared to the noncleaved complex (light gray). (B) SDS-PAGE analysis of the SEC profile in panel A suggests the dissociation of the complex into a truncation of Prt1181C and Tif34 in complex with a truncation of Tif35. Numbers correspond to different fractions of the peak that are marked by a black bar on the chromatogram. 0 is the sample prior to gel filtration. (C) Analytical SEC of Tif32/Nip1 complex treated either with GluC for 2 h (dashed light gray) or with thermolysin for 1 d (solid light gray). Comparison with the noncleaved complex (solid dark gray) proposes the existence of only one complex in each case, indicating the preservation of the interactions between resulted fragments. (D) SDS-PAGE analysis of gel filtration runs in panel C shows the proteolytic fragments to be bound together. Left and right panels are different fractions of the peaks after GluC (dashed gray bar on the chromatogram) and thermolysin (solid gray bar on the chromatogram) treatments, respectively. In each case, 0 indicates the sample prior to the gel filtration. In all cases, M stands for molecular weight marker, and values are in kiloDaltons.

