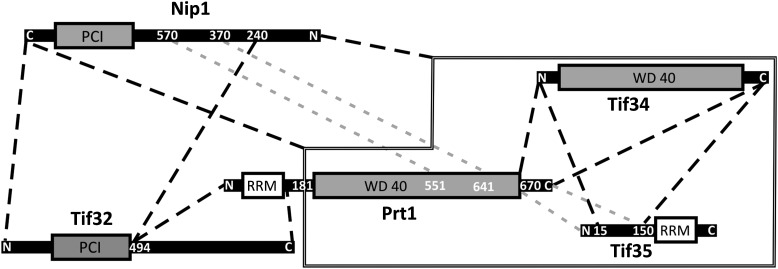
FIGURE 7.
Map of interactions between eIF3 subunits. The stable subcomplexes that could be separated by SEC are depicted by dashed lines. The interaction of Nip1 with Prt1-Tif34-Tif35 subcomplex is represented by a solid line around Prt1-Tif34-Tif35. Binding of Nip1370-570 to Prt1CTD was observed by Valasek et al. (2002), while the binding of Tif35CTD to Prt1CTD was concluded from indirect observations. Therefore these two interactions are represented by a different color (gray dashed lines).

