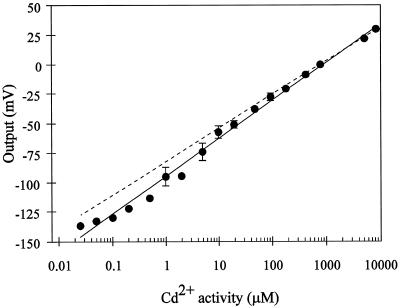
Figure 1.
Calibration curve for the Cd2+ microelectrode in Cd(NO3)2 solutions varying in activity. The electrode's output was arbitrarily defined as 0 for the reading taken when its Cd2+ activity was 784 μm, which corresponds to a 1 mm Cd(NO3)2 solution. The output of electrode potential (relative to the potential of the reference electrode) for the different calibration solutions was then referred to this 0 level. The solid line is the linear regression for the experimental points. The sensitivity (slope) is equal to 32 mV/dec (r2= 0.992). The dotted line represents the Cd2+ electrode's ideal Nernstian change in potential for an electrode that is selective only for Cd2+. ses are shown when they are bigger than the symbol. Data points represent the average responses of four different electrodes.

