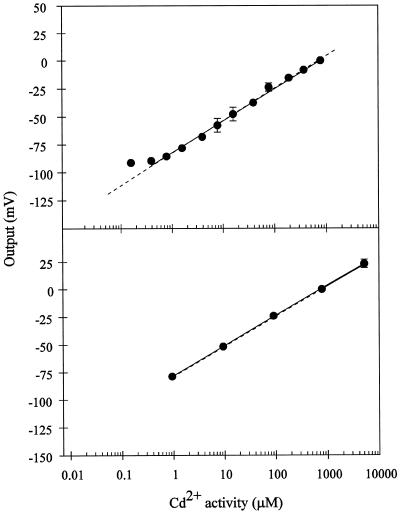
Figure 2.
Calibration curves for the Cd2+ microelectrode in Cd(NO3)2 solutions containing either 200 μm Ca(SO4)2 (top) or 50 μm Ca(NO3)2 (bottom). The electrode response (in millivolts) was arbitrarily defined as 0, as described in Figure 1. The solid line in both cases is the linear regression for the experimental points. The sensitivity (slope) is equal to 29 mV/dec (r2= 0.995 excluding the lowest point) for the calibration in 200 μm Ca(SO4)2 and 27 mV/dec (r2 = 0.999) for the calibration in 50 μm Ca(NO3)2. ses are given if bigger than the symbol. Points represent, respectively, the averages of three and five different electrodes for the 200 μm Ca(SO4)2 (top) and 50 μm Ca(NO3)2 (bottom) background. The dashed line represents the theoretical change in potential for an electrode with ideal Cd2+ selectivity, as calculated by the Nernst equation.

