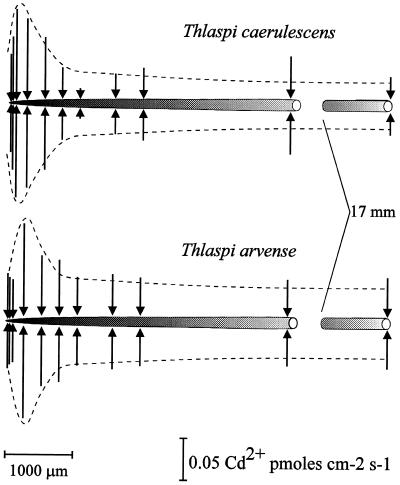
Figure 7.
Diagram illustrating the Cd2+ flux profile along a single root of the Zn/Cd hyperaccumulator T. caerulescens and the nonaccumulator T. arvense. Seedlings were exposed overnight to the 50 μm Ca(NO3)2 plus 5 μm Cd(NO3)2 solution. Flux measurements were carried out in 50 μm Ca(NO3)2 plus 5 μm Cd(NO3)2 at different positions along the root. The position and the magnitude of the fluxes are indicated by arrows, such that arrows directed toward the root indicate influx and arrows directed away from the root denote efflux. Scaling bars correspond to the distance along the root and the flux magnitude. Microelectrodes were vibrated perpendicularly to the root with an amplitude of 30 μm, such that the extremes of the vibration were between 30 and 60 μm from the root surface.

