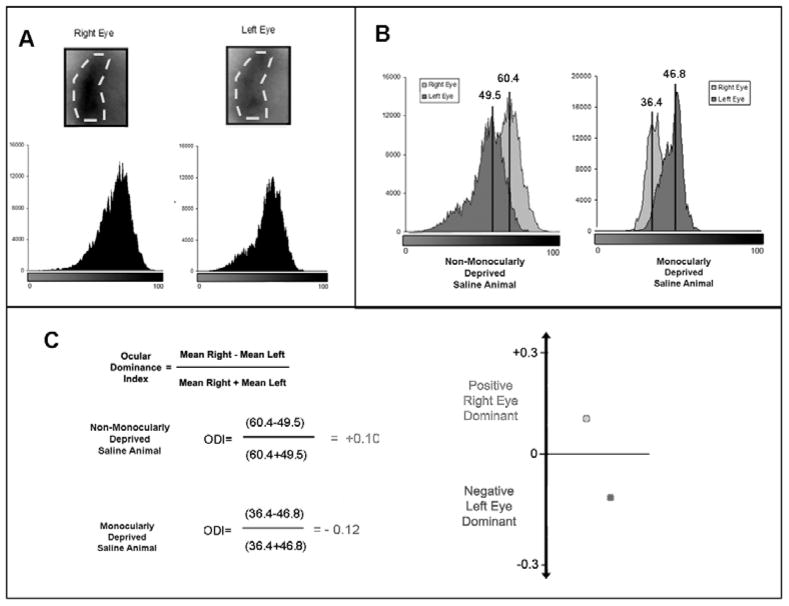
Figure 2. Analysis of optical imaging of intrinsic signals.
To analyze the images acquired using OI, first a region of interest (ROI) is created around the binocular zone for each animal. This area is the same for both right and left eye responses (A). Using this ROI, a histogram of the intensity of each pixel is created for each eye. These responses can then be over laid and the mean pixel intensity for each histogram can be calculated (B). These values are then used to calculate an ocular dominance index for the animal. If this value is greater than one there is a bias towards the right eye, if this value is negative (as for an MD animal) there is a bias towards the left eye (C).

