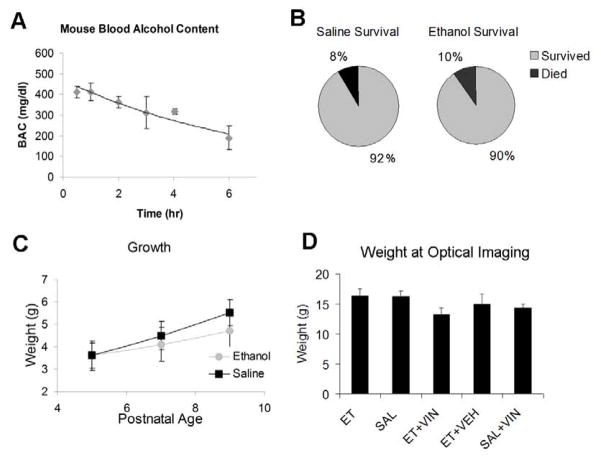
Figure 3. General Effects of Alcohol Treatment.
A) Blood alcohol content was measured at various time points post injection in P7 mice. Mice exhibited a sustained BAC above 300 mg/dl for at least 4 hours. B) Saline and ethanol exposed mice exhibited similar mortality rates during the exposure paradigm. C) Mouse pups treated with ethanol gained less weight during the course of exposure than their saline treated littermates (* p < 0.001). D) At the time of optical imaging, there was no difference in weight between ethanol and saline treated littermates. Et=ethanol, Sal=saline, Veh= vehicle, Vin=vinpocetine

