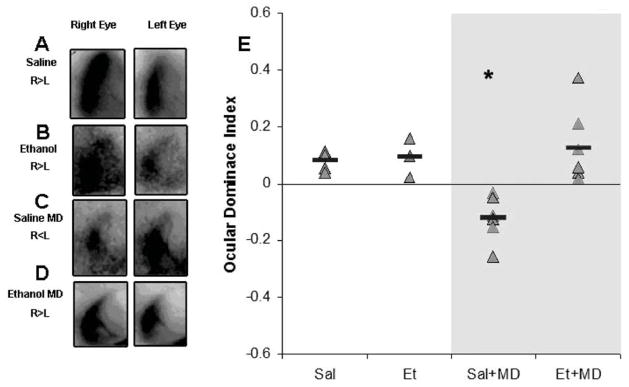
Figure 4. Effect of early alcohol exposure on ODP.
A–D) Optical imaging of intrinsic signals from the left visual cortex of representative cases of each group. Darker maps indicated stronger signals after visual stimulation. Note that in non-deprived animals (A and B) stimulation of the right eye leads to stronger signals than left eye stimulation, which is consistent with the contralateral bias seen in the primary visual cortex of rodents. After 10 days of monocular deprivation (MD) an ocular dominance shift is seen; note the stronger signal after left eye stimulation (C). This shift was not seen in ethanol exposed animals (D) which indicates impairment in ocular dominance plasticity. (E) Quantification of optical imaging findings. Ocular dominance indexes were calculated (see methods); positive and negative values represent whether the cortex is more responsive to the contralateral (right) or ipsilateral (left) eye respectively. Red bars represent average ODI values for each group (* p < 0.0001) Sal=Saline treated; Et= Alcohol-treated; MD= Monocular deprivation.

