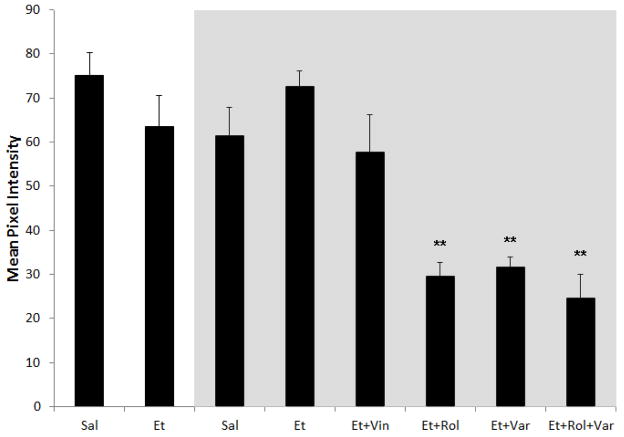
Figure 6. Average Mean Pixel Intensity.
Response magnitude was calculated as the mean pixel intensity for the strongest responding eye for each group. Groups in the grey box represent MD animals. There was no different between saline (Sal) and alcohol (Et) exposed animals with and without MD. When ethanol exposed MD animals treated with PDEis were compared to animals that did not receive PDEi treatment, they were shown to have a significantly lower response magnitude. ** p < 0.001. Vin = vinpocetine, Rol = rolipram, Var = vardenafil

