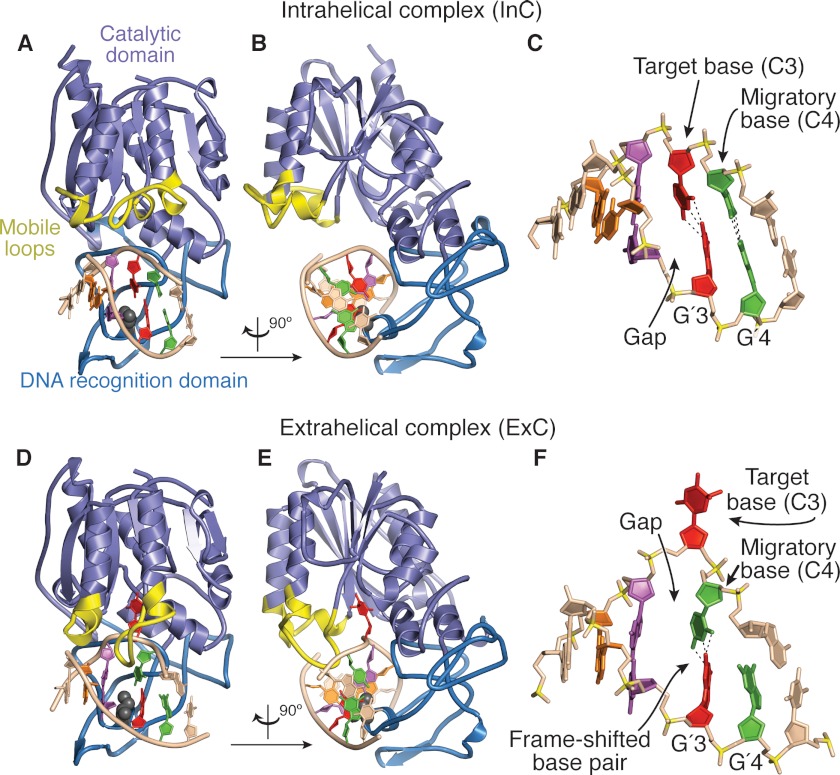
FIGURE 1.
Comparison of the structures of the pre-extrusion complex InC and the trapped catalytic complex ExC. A, overall structure of InC (this work) with various structural elements of the protein highlighted as follows: lilac, catalytic domain; sky blue, sequence-specific DNA recognition domain; yellow, mobile elements that undergo major positional shifts in InC versus ExC. The DNA is shown in schematic representation, with the four bp of the 5′-GGCC site individually color-coded (orange-to-green, 5′-to-3′ on the target strand at the top). The base pairs flanking the M.HaeIII recognition site are colored the same as the rest of the DNA. B, same as A, but rotated by 90° about the vertical axis. C, framework representation of the DNA in the InC structure, with key features denoted; color-coding as in A and B, but with backbone phosphorus atoms in mustard. D and E, two views of ExC (4), formatted as for InC in A and B. F, framework representation of the DNA in ExC, formatted as for InC in C.

