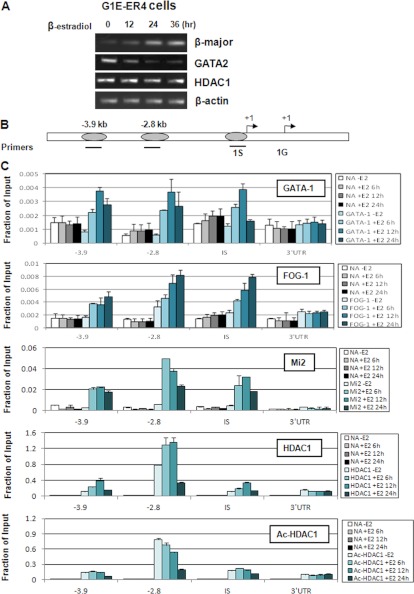
FIGURE 6.
Increasing levels of HDAC1 and decreasing levels of acetylated HDAC1 are recruited to the GATA-2 locus after induction of differentiation in G1E-ER4 cells. A, G1E-ER4 cells were treated with estradiol for the indicated time periods. Total RNA was extracted, and RT-PCR was performed with primers for the indicated genes. B, schematic representation of the mouse GATA-2 locus. Locations of the PCR primer sets are underlined. C, G1E-ER4 cells treated with estradiol were subjected to ChIP with antibodies against GATA-1, FOG-1, Mi2, HDAC1, or acetylated HDAC1. The resulting precipitated DNA was analyzed by real time PCR with the primers indicated. The results of a representative experiment of three independent experiments are shown. Data are means ± S.E. of three real time PCR results. NA, no antibody control.

