FIGURE 1.
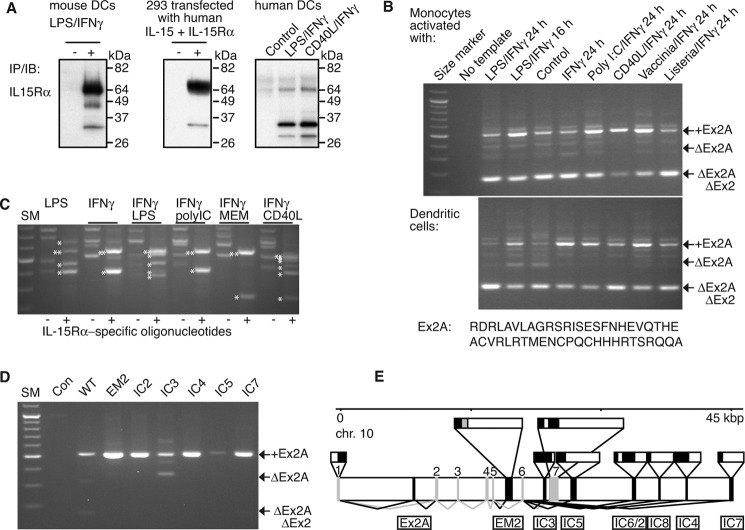
Cloning of IL-15Rα isoforms. A shows differences in the migratory patterns of IL-15Rα on SDS-PAGE. Its expression was induced in murine and in human DCs by exposure to LPS/IFN-γ or CD40L/IFN-γ and in 293 cells by over-expression of human IL-15/IL-15Rα. Analyses were done by immunoprecipitations/immunoblots. While most murine IL-15Rα from DCs and human IL-15Rα from transfected 293 cells migrated at ∼65 kDa with minor species at 35 kDa, the majority of IL-15Rα from human DCs was detected at 35 kDa with a minor species at 65 kDa. Human IL-15Rα from 293 cells and DCs were detected with the same antibody combinations, and two alternative antibodies that were used for both immunoprecipitations and immunoblots gave similar results. B, cDNAs were derived from variably activated human monocytes and DCs and subjected to RT-PCR. A first step with oligonucleotides annealing in the first and last exons of IL-15Rα was followed by a nested step that used oligonucleotides in exons 1 and 3. All resulting PCR products that contained the sushi domain-encoding and IL-15-binding exon 2 also contained an additional 153-bp sequence between exons 1 and 2 that we termed “exon 2A”. The predicted amino acid sequence is shown below the panels. C, further analyses revealed the existence of alternative IL-15Rα splice products at its 3′-end in cDNAs that had been derived from activated DCs. Specific PCR products that contained IL-15Rα sequences are indicated by asterisks left of the bands, double- asterisks denote wild-type IL-15Rα. D, targeting the various C-terminal isoforms in the first PCR step revealed IC3 to be the only isoform that may lack the Ex2A sequence. All PCR products were verified by direct sequencing. E, genomic organization of newly identified exons of human IL-15Rα on chromosome 10. New exons are shown in black and are named below the horizontal bar. Previously described exons are gray and are numbered above the horizontal bar. Lines below the bar depict splicing (black for new and gray for previously known). Exon structures are depicted above the bar with coding regions in black and noncoding regions in white. EM2 encodes an alternative membrane domain that is shown in gray.

