
FIGURE 2.
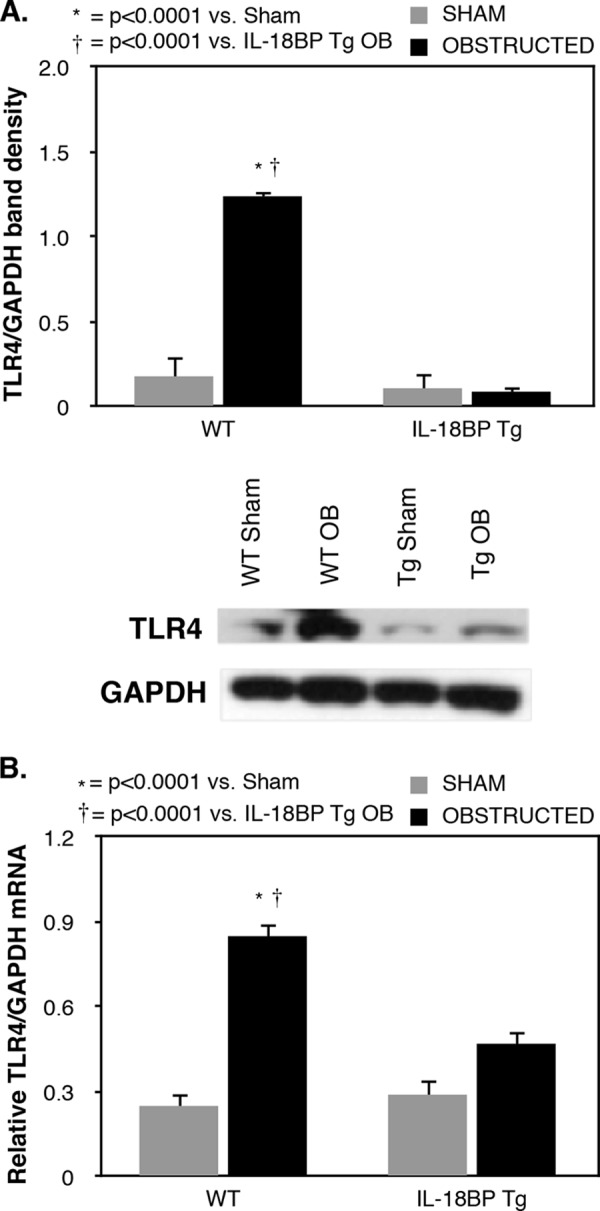
Renal cortical TLR4 expression following UUO. A, gel photograph and densitometric analysis of TLR4 expression represented as percentages of GAPDH in WT and IL-18BP transgenic animals (IL-18BP Tg) exposed to sham operation or 1 week of UUO. B, quantitative TLR4 mRNA expression represented as percentages of GAPDH in WT and IL-18BP Tg animals exposed to sham operation or 1 week of UUO.