
FIGURE 6.
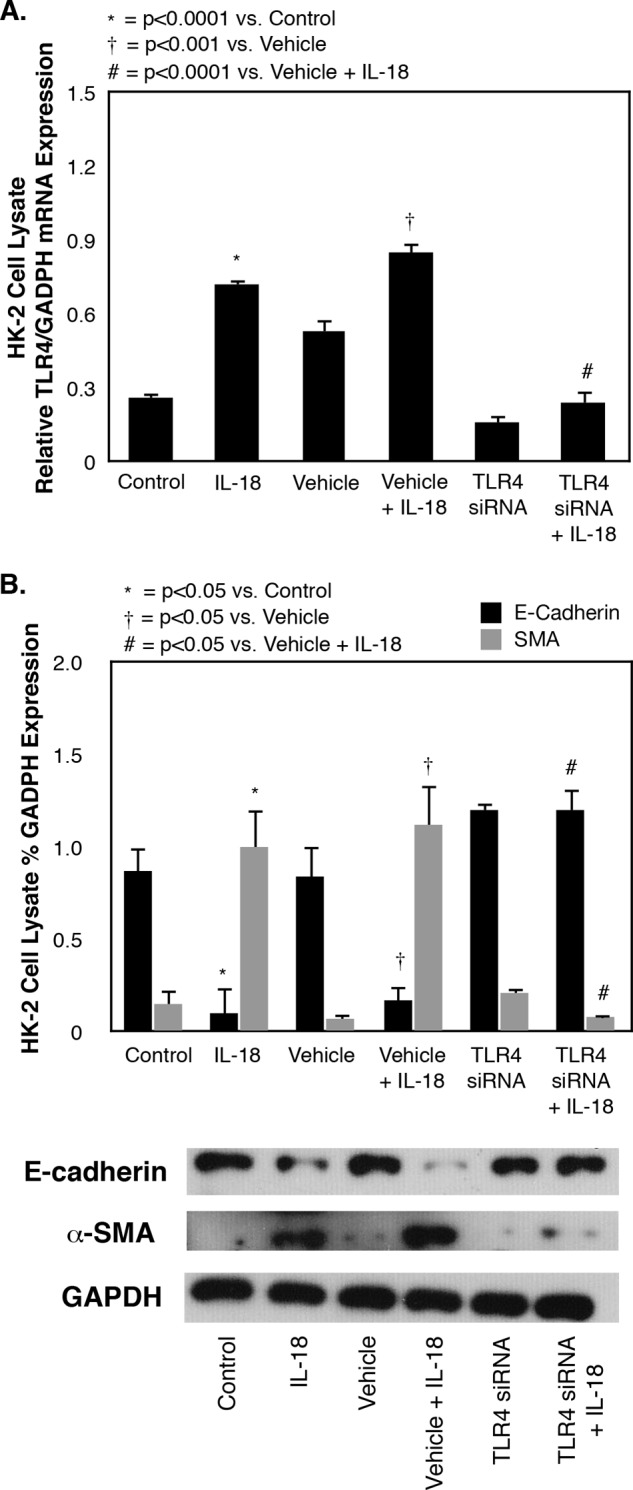
TLR4, E-cadherin, and α-SMA expression in HK-2 cells exposed to TLR4 siRNA knockdown and IL-18 stimulation in vitro. A, quantitative cell lysate TLR4 mRNA expression represented as percentages of GAPDH following 3 days of cell exposure to recombinant human IL-18 (100 ng/ml) in the presence or absence of a TLR4 siRNA (40 pmol). B, gel photograph and densitometric analysis of cell lysate E-cadherin and α-SMA expression represented as percentages of GAPDH following 3 days of cell exposure to recombinant human IL-18 (100 ng/ml) in the presence or absence of a TLR4 siRNA (40 pmol).