FIGURE 5.
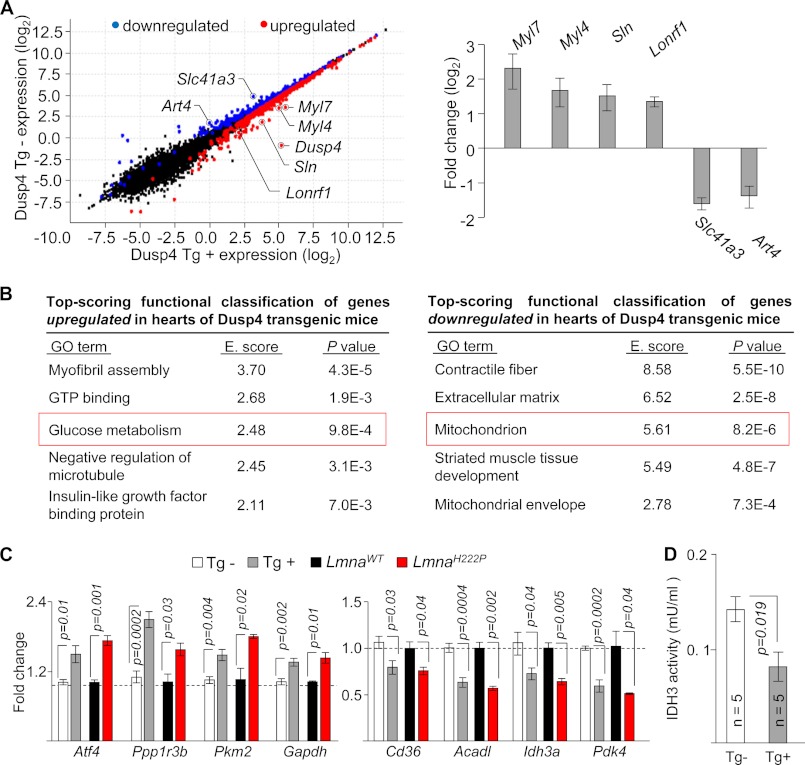
Dusp4 overexpression alters metabolic gene expression. A, scatter plot (left panel) of expression level per genes (based on Cuffdiff analysis) from RNAseq results of 8-week-old hearts from Dusp4 Tg+ and Tg− mice. Genes showing expression of 0 were filtered out to enable plotting. Blue and red circles denote down-regulated and up-regulated genes, respectively, in Dusp4 Tg+ mice relative to Tg− littermates. Black circles denote genes with no significant difference. qPCR validation of Myl7, Myl4, Sln, Lonrf1, Slc41a3, and Art4 mRNA expression is shown on the right. The bar graph represents fold change over transgenic negative controls (n = 6 samples). B, top scoring functional classification of genes up-regulated (left panel) or down-regulated (right panel) in hearts of Dusp4 Tg+ mice using DAVID. GO terms with higher enrichment score (E. score) indicate more significant enrichment. The red boxes highlight GO terms selected for further analysis. C, qPCR validation of mRNA expression of genes associated with “glucose metabolism” that are up-regulated (left panel) and genes associated with “mitochondrion” that are down-regulated (right panel) in hearts of 8-week-old Dusp4 Tg+ mice (n = 6/group), 16-week-old LmnaH222P/H222P mice (n = 3/group), and their respective controls. D, IDH3 enzymatic activity in ventricular tissue isolated from 8-week-old male Dusp4 Tg+ and Tg− mice. mU denotes milliunit in which one unit of IDH3 is the amount of enzyme that will generate 1.0 μmol of NADH/min at pH 8 at 37 °C.

