FIGURE 7.
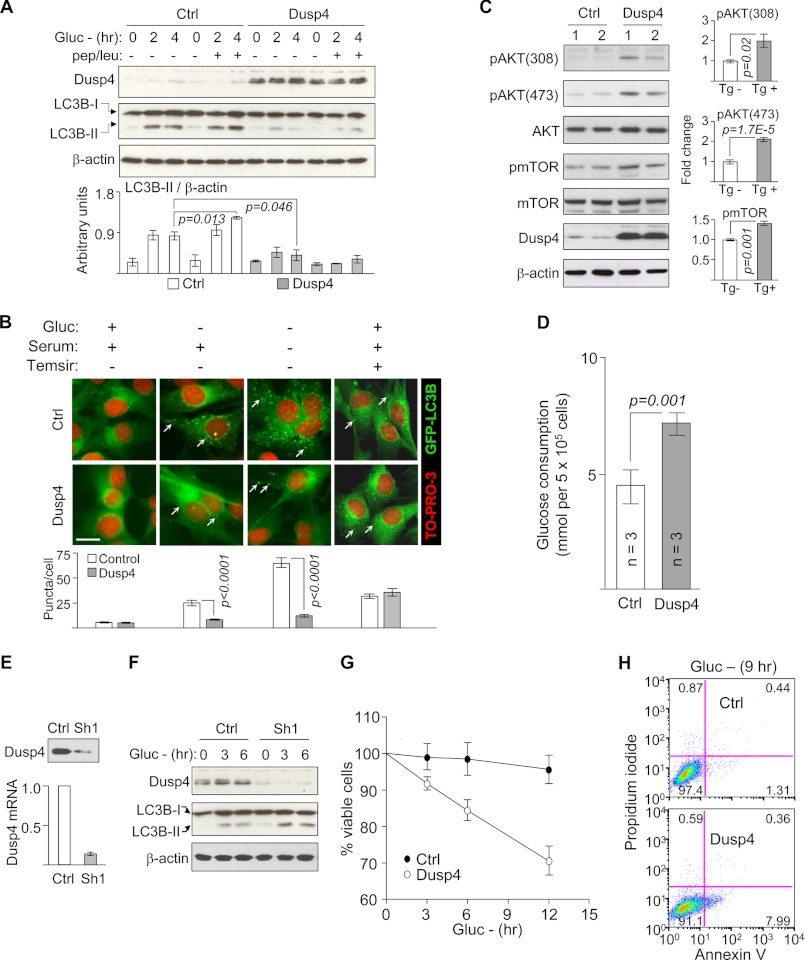
Dusp4 overexpression activates AKT-mTOR and impairs autophagy in C2C12 cells. A, representative Western blot of DUSP4, LC3B, and β-actin in C2C12 stably overexpressing Dusp4 deprived of glucose (Gluc −) for 0, 2, and 4 h or co-treated with pepstatin and leupeptin (pep/leu) (top panel). Ctrl denotes control: C2C12 transduced with empty vector. Untreated and treated with pepstatin/leupeptin are indicated by − and +, respectively. Quantification of LC3B-II is presented in arbitrary units (bottom panel; n = 3 experiments). B, fluorescent micrograph of GFP-LC3B co-expressed in Dusp4-overexpressing or control C2C12 subjected to 9 h of glucose deprivation, 6 h of glucose + serum deprivation, or 6 h of temsirolimus (Temsir) (top panel). White arrows show GFP-LC3B puncta. Removal and addition of glucose, serum, or temsirolimus in culture media are denoted by − and +, respectively. The nuclei were counterstained with TO-PRO-3. Scale bar, 20 μm. Enumerated GFP-LC3B puncta/cell (bottom) (n = 60 cells/condition from three experiments). C, Western blot of pAKT (S473, T308), AKT, pmTOR, mTOR, DUSP4, and β-actin in control and Dusp4-overexpressing C2C12. The numbers above the blots denote individual preparations. Representative blots are shown from two experiments. D, glucose uptake measurements in control and Dusp4-overexpressing C2C12 after 48 h in culture. E, representative Western blot (top panel) and qPCR (bottom panel) of C2C12 with stable knockdown of Dusp4. Ctrl and Sh1 denote C2C12 stably transduced with lentivirus carrying empty vector and shRNA that targets Dusp4, respectively. Dusp4 mRNA values are presented as fold change relative to control (n = 3 experiments). F, Western blot of DUSP4, LC3B-II, and β-actin in C2C12 control or expressing Sh1 deprived of glucose (Gluc −) for 0, 3, and 6 h. LC3B-I denotes nonlipidated LC3B. A representative blot is shown from three experiments. G, cell viability analysis on control and Dusp4-overexpressing cells deprived of glucose (Gluc −) for 0, 3, 6, and 12 h). The data are presented as percentages of viable cells at just prior to glucose deprivation (n = 5 for each time point). H, annexin V/propidium iodide staining of control and Dusp4-overexpressing cells deprived of glucose (Gluc −) for 9 h. The numbers in each quadrant represent percentages of cells. Representative flow cytometry analysis is shown from three experiments.

