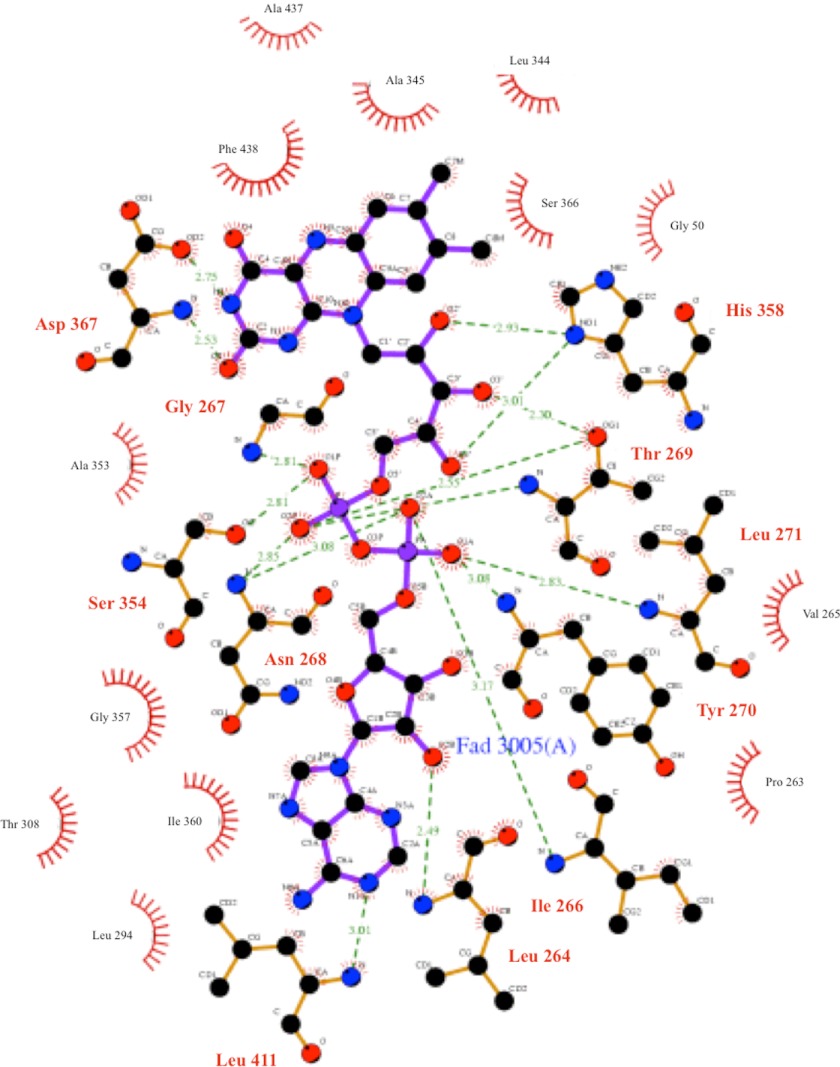
FIGURE 3.
LIGPLOT representation of mAOX3 environment in the FAD binding site. N and O atoms are represented as blue and red balls, respectively. Ligand bonds are in purple, non-ligand bonds are in light brown and hydrogen bonds are green dashed lines. Non-ligand residues in hydrophobic contacts with the ligand, are presented by red semi-circles with radiating spokes.

