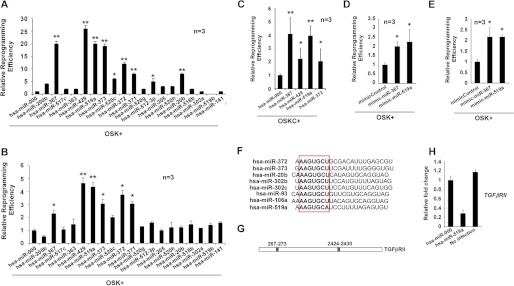
FIGURE 6.
Expression of hsa-miR-519a enhances reprogramming efficiency. A, cell cultures of dFib-OCT4GFP–indOSK-11 were infected with lentiviruses encoding the indicated miRs. Relative reprogramming efficiency normalized to the efficiency observed in pmiR-000-infected cells is shown, with the fold changes indicated. Uninfected cells were used as a negative control for all experiments. n = number of independent experiments. The number of alkaline-positive (AP) colonies was used to calculate the relative reprogramming efficiency. Error bars depict the S.D. pmiR-000, control miR. *, p < 0.05; **, p < 0.01. B and C, similar experiment as described in A, but BJ fibroblasts infected with retroviruses encoding the three factors (B, OSK) or the four factors (C, OSKC) plus lentiviruses encoding the indicated miRs, were used instead. *, p < 0.05; **, p < 0.01. The number of Nanog-positive colonies was used to calculate the relative reprogramming efficiency. D and E, cultures of BJ fibroblasts (D) or dFib-OCT4GFP-ind cells (E) were infected with retroviruses encoding the three factors (OSK) and transfected at days 0 and 5 with 30 nm of the indicated miR mimics. Relative reprogramming efficiency normalized to the efficiency observed in mimic control cells is shown with the fold changes indicated. n = number of independent experiments. Error bars depict the S.D. *, p < 0.05; **, p < 0.01. The number of NANOG-positive colonies was used to calculate the relative reprogramming efficiency. F, alignment of different embryonic stem cell-enriched miRs. The seed sequence is highlighted in the box. G, schematic representation of the putative target sites of miR-519a for the TGFβRII mRNA. H, real-time PCR analysis to detect the transcripts of TGFβRII in BJ fibroblasts that were either uninfected or infected with the indicated lentiviruses. Data are shown as relative means ± S.D. of two biological replicates analyzed in triplicate.

