FIGURE 7.
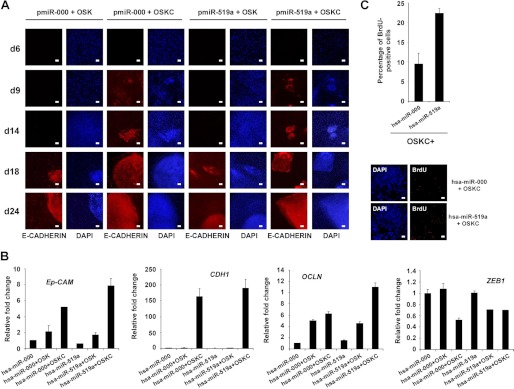
Expression hsa-miR-519a increases proliferation. A, BJ fibroblasts were infected with three (OSK) or four (OSKC) reprogramming factors together with either hsa-miR-519a or has-miR-000 (scrambled control). Expression of E-cadherin was monitored by immunofluorescence analysis at different time points during reprogramming. DAPI was used to visualize the nuclei. d, day. Scale bar = 200 μm. B, real-time PCR analysis to detect the endothelial (Ep-CAM, E-cadherin, and OCLN) and mesenchymal (ZEB1) markers were performed with RNA obtained from BJ fibroblasts infected with three (OSK) or four (OSKC) reprogramming factors together with either hsa-miR-519a or has-miR-000 (scrambled control). RNA extraction was performed 6 days after infection. Data are shown as mean ± S.D. of two biological replicates analyzed in triplicate. C, graph showing the percentage of BrdU+ cells in BJ fibroblast 6 days after infection with OSKC plus lentiviruses expressing the indicated miRs (upper panel). Three independent experiments were performed, and the results are represented as means ± S.D. of at least 200 cells in four different fields in each experiment. Immunofluorescence analysis showed a representative field (lower panel). DAPI was used to visualize nuclei. Scale bar = 200 μm.

