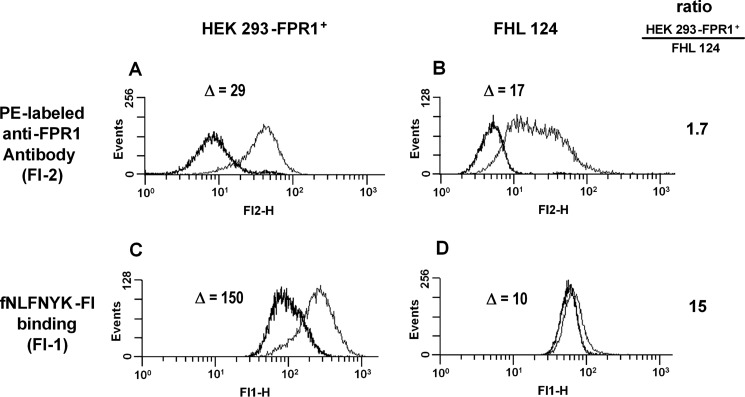
FIGURE 4.
FPR1 adopts distinct states in lens epithelial cells and FPR1-transfected HEK 293 cells; evidence from flow cytometry. A and B, staining of HEK 293-FPR1+ cells (A) and FHL 124 cells (B) with anti-FPR1 is shown. Gray, anti-FPR1; black, isotype control. C and D, specific binding of fNLFNYK-Fl (10 nm) to HEK 293-FPR1+ cells (C) and FHL 124 lens epithelial cells (D) is shown. Gray, total binding; black, nonspecific binding. Specific binding was calculated by subtraction of nonspecific binding (in the presence of 10 μm fMLF) from total binding (10 nm fNLFNYK-Fl without fMLF). Δ represents the difference between anti-FPR1 staining and isotype control background (A and B) or between total and nonspecific binding (C and D). The ratio of Δ(HEK 293-FPR1+)/Δ(FHL 124) is shown on the right. The data are from one representative experiment that was reproduced twice.

