FIGURE 6.
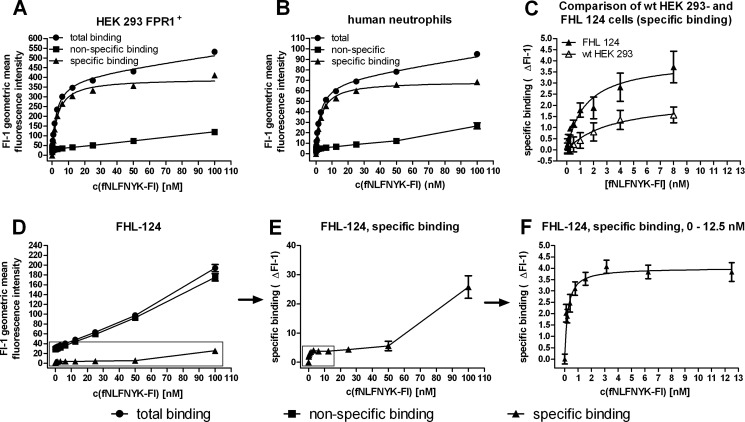
Characterization of high affinity binding sites for fluorescent FPR1 ligand fNLFNYK-Fl on lens epithelial cells. Specific binding (▴) was calculated by subtraction of nonspecific binding (■, presence of peptide W at a 1000-fold excess compared with fNLFNYK-Fl) from total binding (only fNLFNYK-Fl, ●). A and B, total, nonspecific, and specific binding of fNLFNYK-Fl to HEK 293-FPR1+ cells (A) and human neutrophils (B) is shown. C, comparison of specific binding of fNLFNYK-Fl to FHL 124 cells and untransfected HEK 293 cells is shown. D–F, saturation binding of fNLFNYK-Fl to FHL 124 lens epithelial cells shows the complete curves for total, nonspecific, and specific binding (D) as well as the complete specific binding curve alone (E) and the first part of the specific binding curve between 0 and 12 nm (F). All fluorescence data were recorded in the FL-1 PMT of a FACSCaliburTM flow cytometer at the same Fl-1 PMT settings (510 V). A–C show representative experiments with 2–3 replicates; the curves shown in D–F are the average of three independent experiments with 2–3 replicates.

