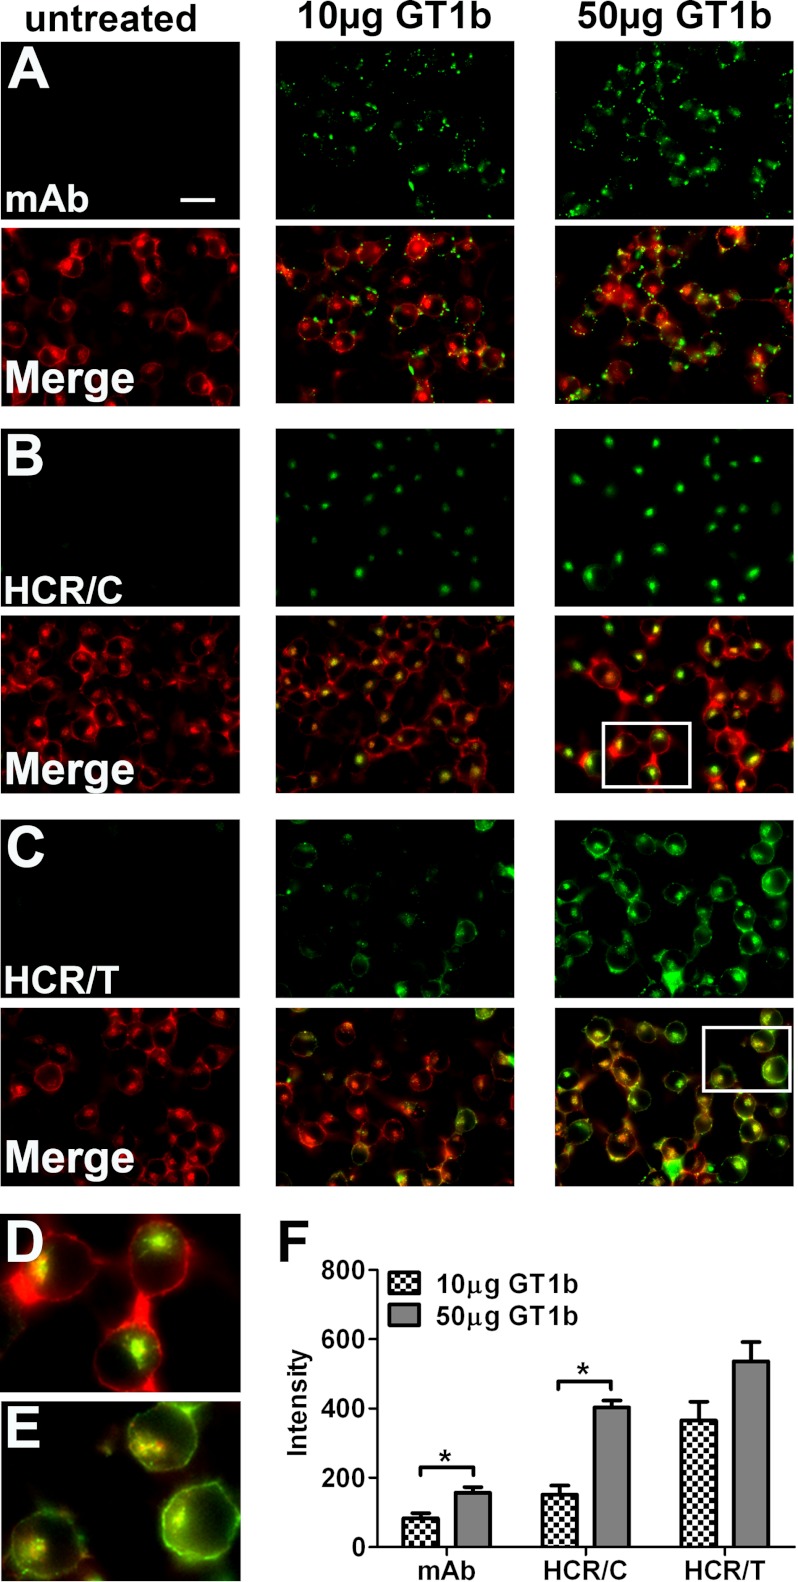
FIGURE 1.
GT1b-enriched Neuro-2A cells support HCR/C entry. N2A cells were untreated or enriched with 10 or 50 μg of GT1b/well for 4 h. Cells were washed and incubated in PBS alone or with 40 nm of the indicted HCR in PBS for 30 min at 37 °C. Unbound HCR was washed away, and cells were processed for microscopy. Exogenous GT1b was detected with an anti-GT1b antibody (mAb). HCR was identified with an anti-HA antibody. Cellular actin was identified by staining with phalloidin. Image exposure settings were identical between treatments. Representative ×60 micrographs are shown. HCR images were set to equivalent brightness and contrast levels using ImageJ. The brightness of the mAb images was increased relative to the HCR images for publication. A–C, the upper rows show the signals detected for the anti-GT1b antibody (A), HCR/C (B), and HCR/T (C). The lower rows show the merged images created from the antibody or HCR signal overlaid with the actin signal. Scale bar = 20 μm. D, the boxed area from B is expanded and shown here. Notice how the HCR/C signal is exclusively intracellular, as the actin positive compartment appears green/yellow and the cell periphery is red. E, the boxed area from C is expanded and shown here. Notice how the HCR/T signal is intracellular and bound to the plasma membrane as the intracellular compartment and the cell periphery are green/yellow in the merged image. F, quantification of microscopic data. All images (mAb and HCRs) were set to equivalent brightness and contrast for quantification using ImageJ. Three fields were captured per treatment. The average GT1b antibody (mAb) or HCR signal was determined. The average intensity measured in N2A cells without exogenous ganglioside was determined and subtracted from the average intensity in ganglioside-treated wells, and the ganglioside-dependent mAb or HCR intensity is reported. The average of two independent experiments is shown. Asterisk denotes statistical significance (*, p < 0.05).

