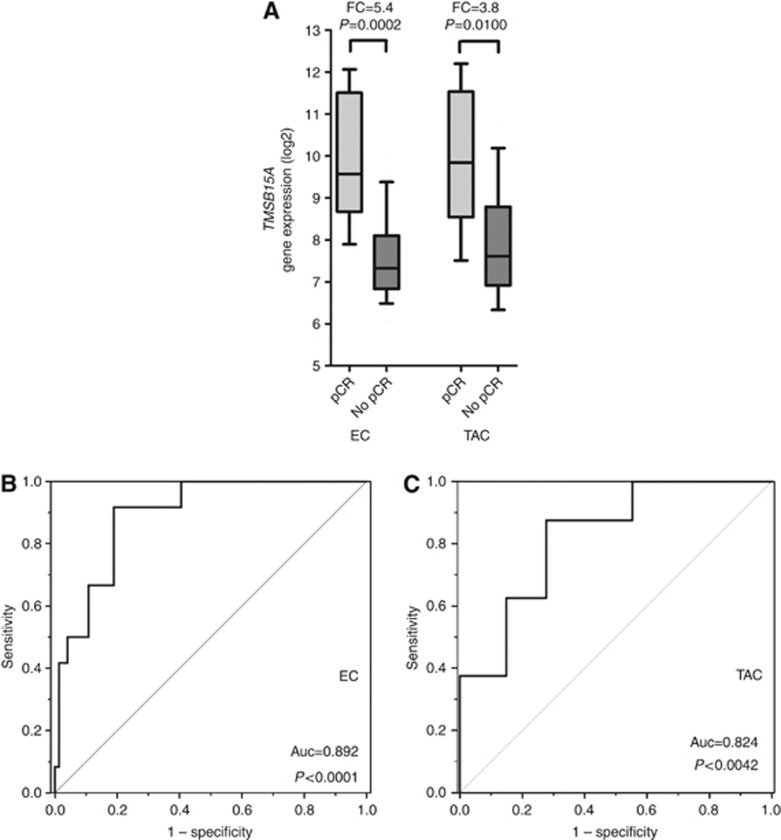
Figure 2.
Distributions of TMSB15A gene expression in dependence of pCR in the EC cohort and the TAC cohort bold lines: medians; whiskers, 10–90th percentile; FC= fold change, P, Mann–Whitney test. (B, C) Reciever operator characteristic (ROC) curves for TMSB15A gene expression in the EC and TAC cohort. Abbreviation: Auc=area under the curve.

