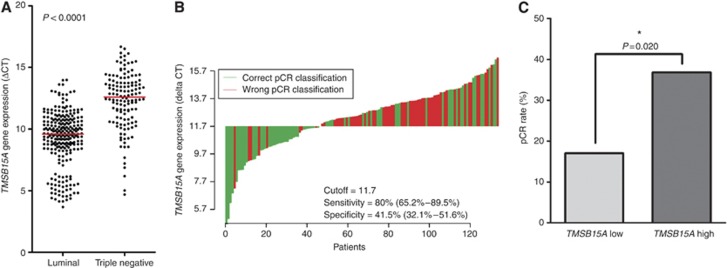
Figure 4.
(A) Distribution of TMSB15A expression in luminal cancers and TNBC from GeparQuattro. Dots indicate individual tumours. Red lines, medians. P, Mann–Whitney test. (B) Waterfall plot for TNBC in GeparQuattro charts each tumour as a vertical bar. Green bars represent cases with correct pCR classification, red bars represent cases with wrong pCR classification. Sensitivity and specificity of the cutoff point are indicated. (C) Pathological complete response (pCR) rates in dependence of TMSB15A status in TNBC from GeparQuattro. For dichotomisation into a TMSB15A low and high expression group, the cutoff point of 11.7 ΔCT, which had been pre-defined in GeparTrio, was used. P-values were calculated by logistic regression. *Indicates significant values. The colour reproduction of this figure available at the British Journal of Cancer online.

