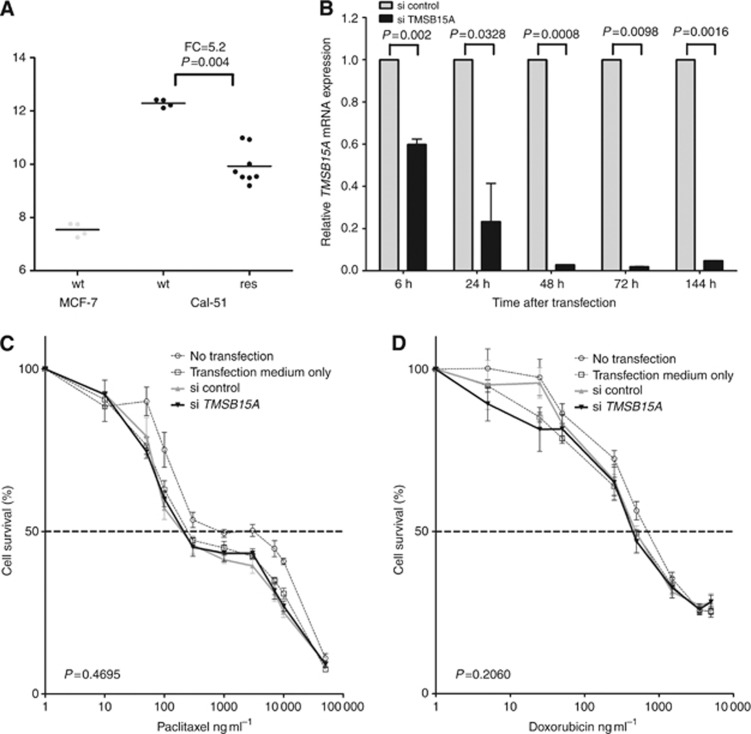
Figure 5.
(A) TMSB15A mRNA levels (Affymetrix HG U133A microarray; probe set 205347_s_at) in MCF-7 and Cal-51 breast cancer cell lines. For clones of wild type (wt), cells were measured (dots), four clones of paclitaxel-resistant (res) Cal-51 were measured twice (dots). Expression levels in wt and res Cal-51 were compared by Mann–Whitney test. Bold lines, mean; FC=fold change. (B) TMSB15A mRNA expression in parental Cal-51 cells transfected with siRNA against TMSB15A (si TMSB15A) relative to cells transfected with control siRNA (si control). P, columnar t-test. (C) Dose–response curves for wild-type Cal-51 treated with increasing concentrations of paclitaxel (left panel) and doxorubicin (right panel) 24 h after siRNA transfection. Comparison of si control (bold grey line) with si TMSB15A treated cells (bold black line) were made by paired t-test. Dashed line, IC50.

