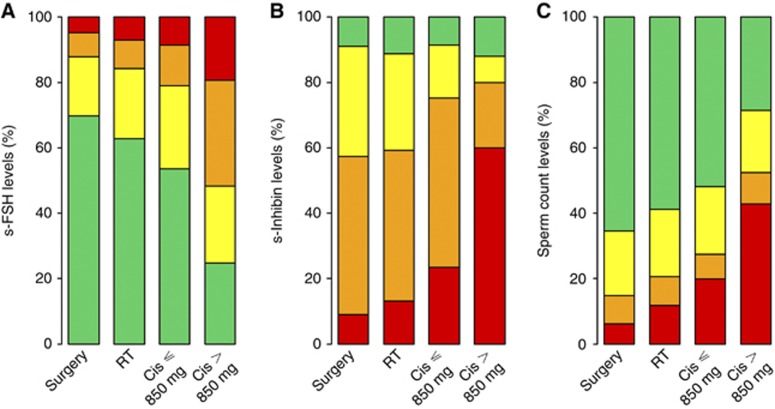
Figure 1.
Fraction of men with grouped variables of s-FSH (A), s-inhibin B (B), and sperm counts (C) according to treatment. The colour range illustrates increasing pathological levels from normal (green) to most pathological (red). (A) For s-FSH (IU l−1): green <12, yellow 12–23.9, orange 24–36, red ⩾36. (B) For s-inhibin B (ng l−1): green ⩾140, yellow 80.01–139.9, orange 7–80, red <7, and (C) for sperm counts (millions per ml): green normospermia (⩾15.0), yellow oligozoospermia (2.0–14.9), orange oligozoospermia (few visible sperm-1.9), and red azoospermia. (P<0.001 for s-FSH and s-inhibin B, P=0.001 for sperm counts, Kruskal–Wallis test, exact using Monte Carlo method).

