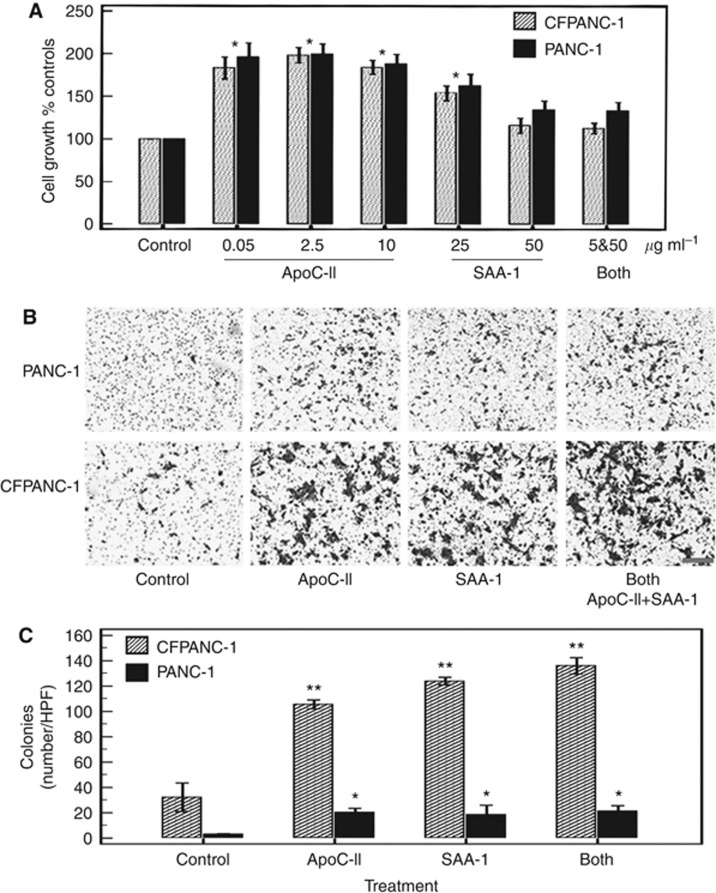
Figure 5.
(A) The influence of ApoC-II and SAA-1 on cell growth (mean values±s.e.m.), as a percentage of controls after 24 h for CFPAC-I (shaded bars), and PANC-I (solid bars). Two-way analysis of variance showed no difference between cell lines. ApoC-II increased cell growth above that of controls (P<0.001 for both cell lines) and greater than the combined treatment with ApoC-II and SAA-1. SAA-1 increased cell growth at the lower dose of 25 μg ml−1 P<0.001, but not at the higher dose 50 μg ml−1, which was less stimulatory than each dose of ApoC-II (P<0.001). ‘*’ indicates different from controls, P<0.001. 5 and 50 indicates 5 μg ml−1 ApoC-II and 50 μg ml−1 SAA-1. (B) Micrograph of × 10 magnification transwell invasion assay for PANC-1 and CFPAC-1 cells treated with control solutions, ApoC-1, SAA-1 and both treatments. Bar =200 μm. (C) Cell counts per high power field at × 10 results for 3–4 fields (mean values±s.e.m.). Analysis of variance indicated a significant increase from controls for CFPAC-1 cells (**P<0.001) and for PANC-1 cells (*P<0.02). When treatments were combined, the apparent increase did not reach significance.

