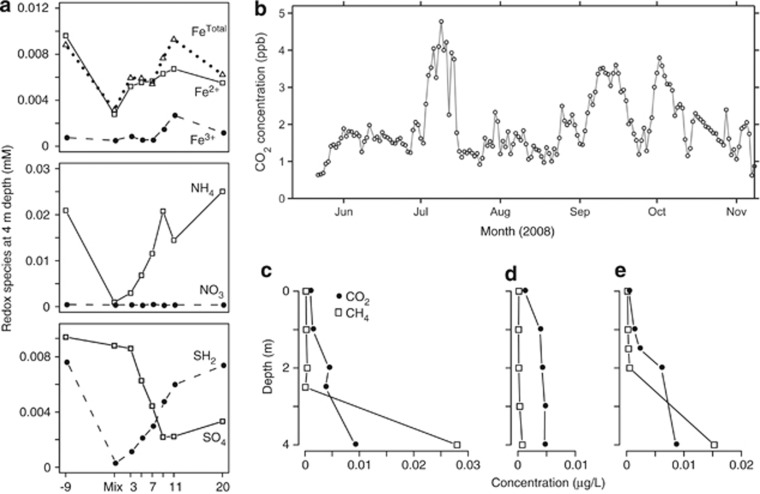
Figure 2.
Changes in measured water chemistry before and after lake mixing. (a) Microbial oxidation–reduction chemistry measured at 4 m depth (hypolimnion) over the mixing experiment. Pre-mixing, Mix and post-mixing time points are on the x axis. (b) Dissolved gas concentrations over the mixing experiment. Daily average carbon dioxide concentration in the surface waters of North Sparkling Bog during the ice-free period of 2008, measured by a carbon dioxide sensor deployed on the lake. (c) Methane (open symbols) and carbon dioxide (closed symbols) profiles for day −9 (pre-manipulation), for (d) Mix (when complete mixing was achieved), and for (e) day 20 (post-mixing). c–e were measured using standard analyses of depth-discrete, manually-collected samples.

