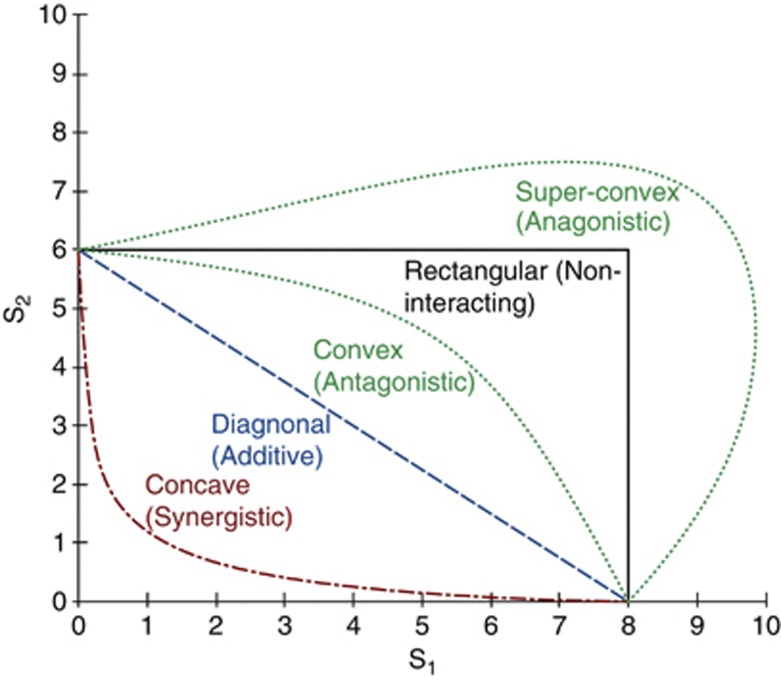
Figure 1.
Five classes of fundamental niche morphology and underlying stress interactions. Axes measure the deviations from the optimal conditions (the origin), that is, the stress due to the environmental factors. The curves represent niche boundaries, with the area contained between a curve and the axes corresponding to the fundamental niche area. Each curve is labeled according to its shape, with the corresponding type of stress interaction indicated in parentheses. Note that only the positive quadrant (both non-consumable environmental factors above their optimal levels) is depicted.

