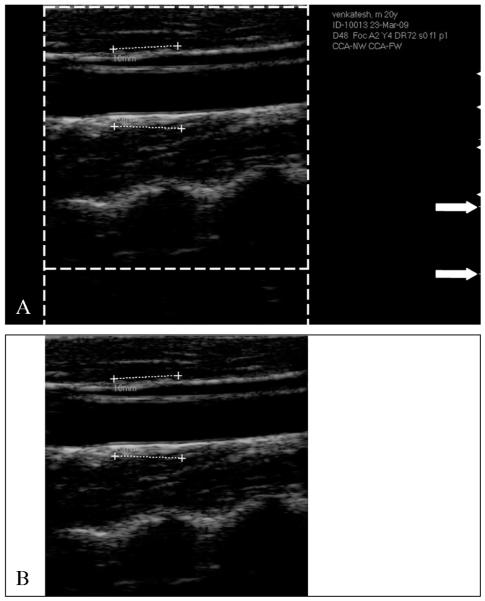
Figure 3.
CALEX 3.0 automated cropping. A) Original image. The dashed lines delimit the region containing the ultrasound data. Outside the dashed lines, the vertical and horizontal gradients are null. The white arrows on the right indicate the vertical scale for the measurement of the conversion factor. B) Cropped image.

