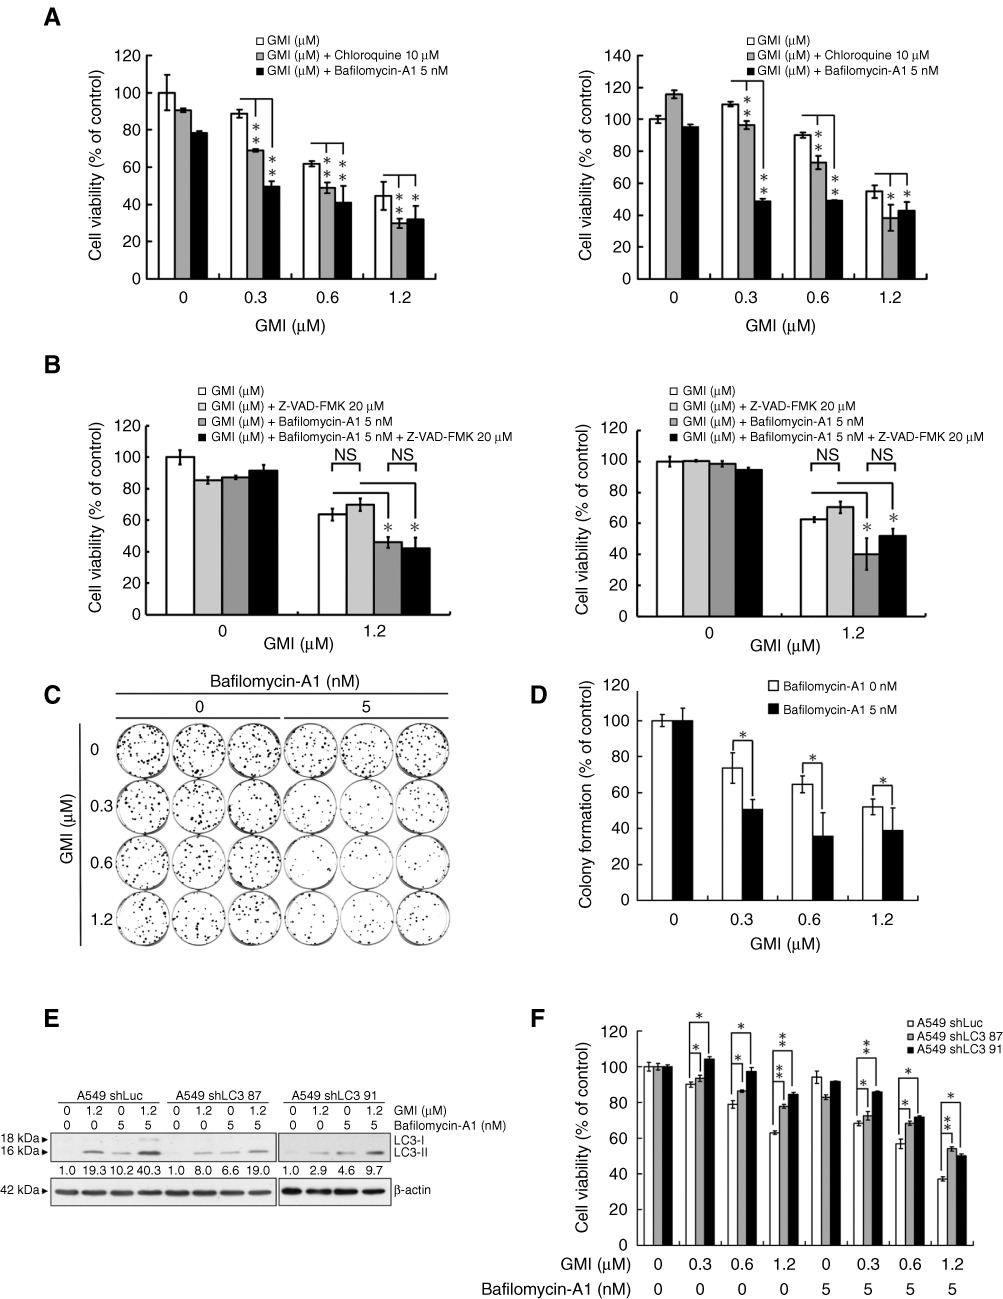
Figure 1.

Effect of lysosome inhibitors on GMI-induced autophagic cell death in non-small cell lung cancer cells. (A) A549 and CaLu-1 cells (5 × 10³ cells per well of 96-well plate) were co-treated with various concentrations of GMI (0, 0.3, 0.6 and 1.2 µM) and chloroquine (0, 10 µM) or bafilomycin-A1 (0, 5 nM) for 48 h. Cell viability was analysed on MTT assay. The data are presented as mean ± SD of triplicate experiments. (B) A549 and CaLu-1 cells (5 × 10³ cells per well of 96-well plate) were pretreated with 20 µM pan-caspase inhibitor Z-VAD-FMK for 1 h, followed by exposure to GMI (0, 1.2 µM) and bafilomycin-A1 (0, 5 nM) for 48 h. MTT assay was performed to measure the cell viability. The data are presented as mean ± SD of triplicate experiments. (C) Equal numbers of cells from the A549 cell pools co-treated with GMI and bafilomycin-A1 were plated and stained as described in Appendix S1. Shown are three dishes from each pool. (D) The number of colonies was counted under a dissecting microscope. The number of cells in each colony had to be larger than 50. Shown are the relative colony numbers. The number of A549 cells without GMI treatment was set at 100%. The original numbers of colonies of A549 cells without or with bafilomycin-A1 treatment are as follows: bafilomycin-A1 0 nM, 88.3 ± 3.5; bafilomycin-A1 5 nM, 74.7 ± 6.7. (E) Equal amounts of total cell lysates from A549 shLuc and A549 shLC3 cells (5 × 10⁵ cells per 60 mm dish) after 1.2 µM GMI treatment were analysed by Western blot. (F) After co-treatment with bafilomycin-A1 (0, 5 nM) and GMI (0, 0.3, 0.6 and 1.2 µM) for 48 h, the cell viabilities of A549 shLuc and A549 shLC3 cells (5 × 10³ cells per well of 96-well plate) were measured on MTT assay. The data are presented as mean ± SD of triplicate experiments. The symbols (*) and (**) indicate P < 0.05 and P < 0.0001 using Student's t-test. NS, not significant.
